Posts about Tableau
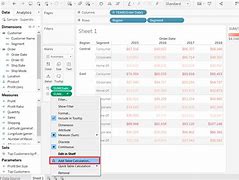
Tableau crosstases
May 26, 2021 05:00 0 Comment Tableau
Simple crosstases, Simple crosstases, Crosstap - Color coding, A crosstab with a percentage of rows, A crosstabb chart in a table, also known as a text table, displays data as text., /b10>, A chart consists of one or more dimensions and one or more me
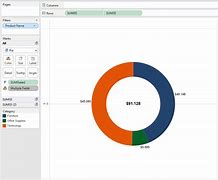
Tableau pie chart
May 26, 2021 05:00 0 Comment Tableau
Simple pie chart, Simple pie chart, Under the drill pie chart, Pie charts represent data as slices of circles of different sizes and colors., /b10>, The slices are marked, and the numbers corresponding to each sli
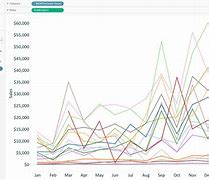
Tableau line chart
May 26, 2021 05:00 0 Comment Tableau
A simple line chart, A simple line chart, Multi-measure line chart, A line chart with a label, In a line chart, measures and dimensions are made along two axes in the chart area., /b10>, A pair of values for each observation becomes a point, and
Tableau filter action
May 26, 2021 05:00 0 Comment Tableau
Create a filter, Create a filter, Create a filter for the measure, Create a dimension filter, Clear the filter., Any data analysis and visualization involves a wide range of data filtering., /b10>, Tableau has a number of filtering options to meet these needs., /
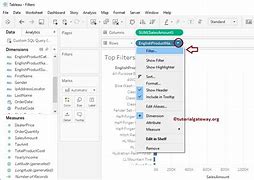
Tableau top filter
May 26, 2021 05:00 0 Comment Tableau
Create a top filter, Create a top filter, The Top option in the Tableau filter is used to limit the result set of the filter., /b10>, For example, from a large set of sales records, we only wa
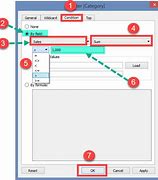
Tableau condition filter
May 26, 2021 05:00 0 Comment Tableau
Create a conditional filter, Create a conditional filter, One of the important filtering options in Tableau is to apply some conditions to filters that already exist., /b10>, These conditions can be very simp
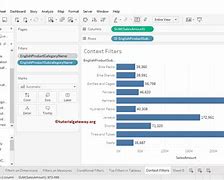
Tableau context filter
May 26, 2021 05:00 0 Comment Tableau
Create a context filter, Create a context filter, Normal filters in Tableau are independent of each other. T, his means that each filter reads all rows from the source data and creates its own results
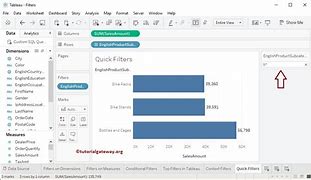
Tableau Quick Filter
May 26, 2021 05:00 0 Comment Tableau
Example, Example, Clear the filter, Many filter types in Tableau can be quickly available with right-click options for dimensions or measures., /b10>, These filters, called quick filters
Tableau basic filter
May 26, 2021 05:00 0 Comment Tableau
Filter size, Filter size, Example, Filter measures, Example, Filter the date, Example, Filtering is the process of removing certain values or ranges of values from a result set., /b10>, Tableau filtering allows you to use field values as
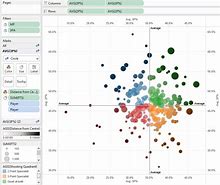
Tableau scatter chart
May 26, 2021 06:00 0 Comment Tableau
Simple scatter chart, Simple scatter chart, Scatter chart - color coding, Lower drill-off point diagram, As the name implies, scatterpout charts show many points scattered across the Descartes plane., /b10>, It was created by drawing the values of numeric
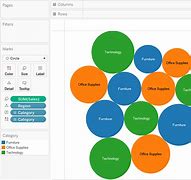
Tableau bubble chart
May 26, 2021 06:00 0 Comment Tableau
Simple bubble chart, Simple bubble chart, A bubble chart with measurements, Bubble map with measure color, The bubble chart displays the data as a circular cluster., /b10>, Each value in the dimension field represents a circle, and the measure represents th
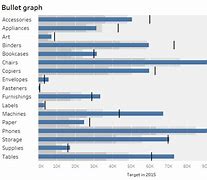
Tableau bullet map
May 26, 2021 06:00 0 Comment Tableau
Create a bubble chart, Create a bubble chart, A bullet map is a variant of a bar chart., /b10>In this chart, we compare the value of one measurement with another measurement in the context of find
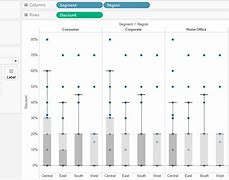
Tableau box row diagram
May 26, 2021 06:00 0 Comment Tableau
Create a case diagram, Create a case diagram, A box chart with two sizes, A box diagram is also known as a box-must chart., /b10>, They show the distribution of values along the axis., /b11>, The box represents the middle 50
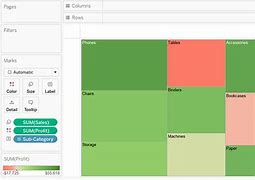
Tableau tree map
May 26, 2021 06:00 0 Comment Tableau
Create a tree map, Create a tree map, A tree map with two dimensions, The tree diagram displays the data in a nested rectangle., /b10>, Define the dimensions of the tree structure and a measure that defines the size or c
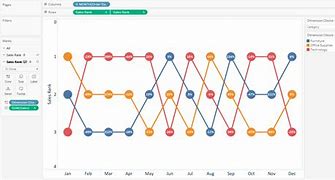
Tableau bump chart
May 26, 2021 06:00 0 Comment Tableau
Create a bump chart, Create a bump chart, Bump charts are used to compare two dimensions using one of the Measure values., /b10>, They are useful for exploring changes in the values of time or