Tableau tree map
May 26, 2021 Tableau
Table of contents
The tree diagram displays the data in a nested rectangle. /b10> Define the dimensions of the tree structure and a measure that defines the size or color of a single rectangle. /b11> Rectangles are easy to visualize because the size and shadow of the rectangle's color reflect the value of the measure.
Create a tree map using one or more dimensions that have one or two measures.
Create a tree map
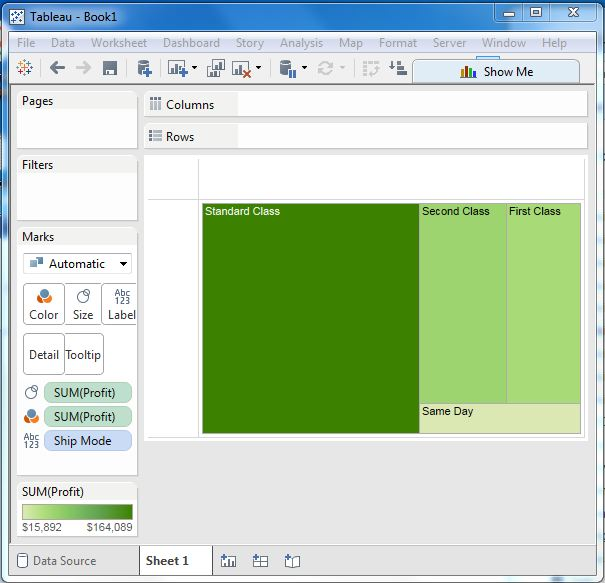
Using Theample-superstore, we plan to find out the profit size of each Ship model value. /b10> To achieve this, we follow these steps.
Step 1
Drag and drop the measured profit to the Mark card twice. /b10> Once to the size of the shelf, to the color shelf.
Step 2
Drag and drop dimension shipping mode onto the label shelf. /b10> From the show I select the chart type tree chart. /b11> The following image appears.
A tree map with two dimensions
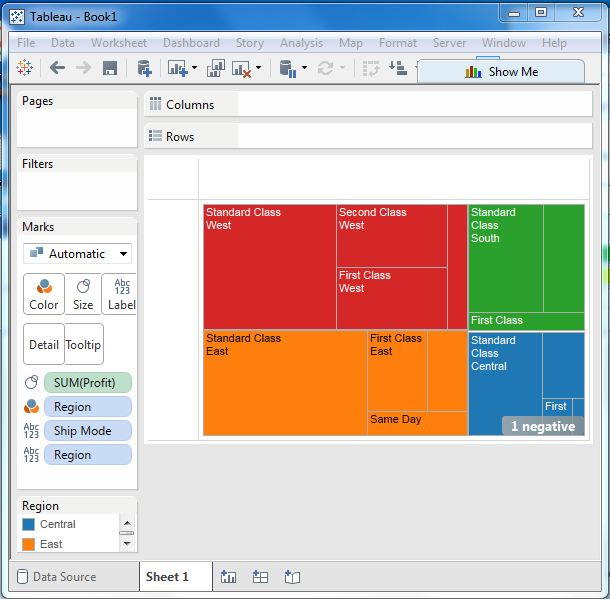
Let's add dimensions to the Tree map chart above. /b10> We drag and drop it twice. /b11> Color shelves at once and label racks again. /b12> The following image appears, showing four boxes for four areas, followed by boxes for shipping patterns nested within them. /b13> Please note that all the different regions now have different colors.