Tableau basic filter
May 26, 2021 Tableau
Table of contents
Filtering is the process of removing certain values or ranges of values from a result set. /b10> Tableau filtering allows you to use field values as well as two simple scenarios for advanced calculations or context-based filters. /b11> In this tutorial, we'll consider the basic filters available in Tableau.
Tableau has three types of basic filters, as follows:
- A filter dimension is a filter that is applied to a dimension field.
- A filter measure is a filter that is applied to a measure field.
- Filter Date is a filter that applies to a date field.
Filter size
These filters are applied to dimension fields. /b10> Typical examples include filtering based on text categories or values with logical expressions larger or less than the condition.
Example
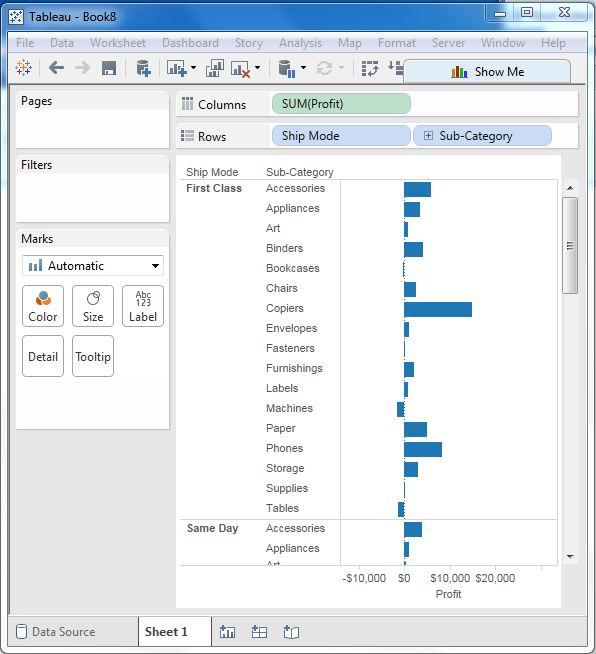
We use the Sample-Superstore data source to apply dimension filters to subcategories of products. /b10> We create a view that shows the profits of each subcategory of products based on their shipping patterns. /b11> To do this, we drag the dimension field Subcategory to the row shelf and the measure field Profit to the column shelf.
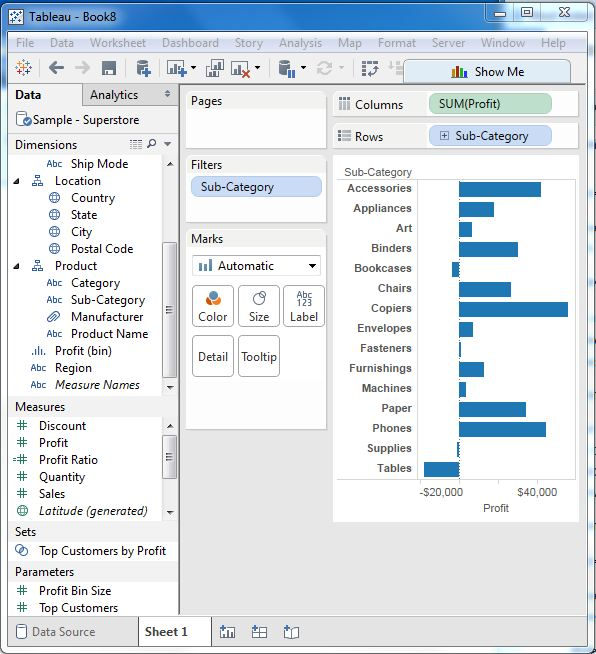
Next, drag the subcategory dimensions to the filter shelf to open the filter dialog box. /b10> Click the no button at the bottom of the list to deselet all clips. /b11> Then select the exclusion option in the lower right corner of the dialog box. /b12> Finally, select Labels and Storage, and then click OK. /b13> The following illustration shows the results of excluding both categories.
Filter measures
These filters are applied to the measure field. /b10> Filtering is based on calculations applied to measure fields. /b11> Therefore, in the dimension filter, we only use values for filtering, and in the measure filter we use field-based calculations.
Example
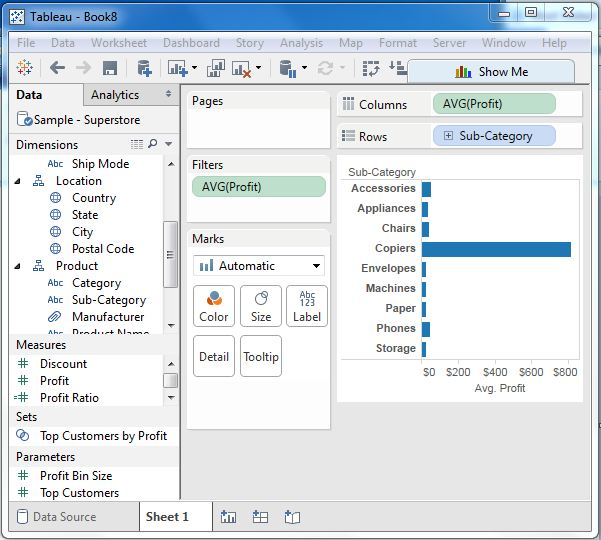
We use the Ample-Superstore data source to apply dimension filters to the average of profits. /b10> First, we look at the ship patterns and subcategories as dimensions and profit averages as shown below.
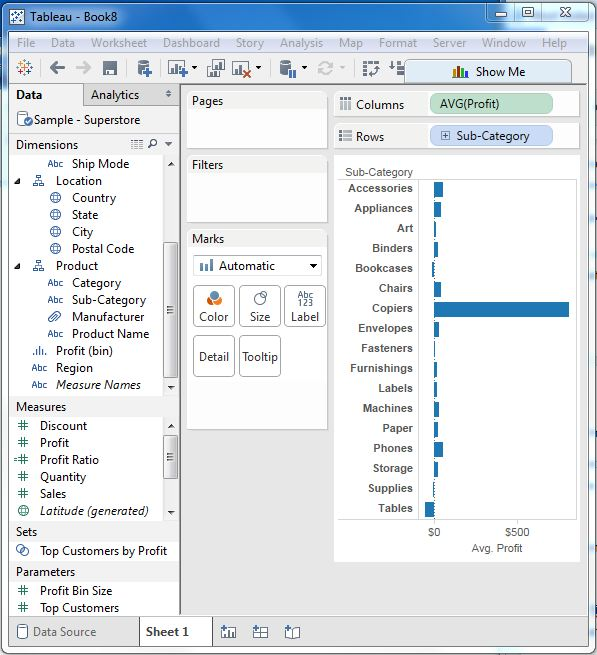
Next, we drag the AVG (profit) value to the filter pane. /b10> Select the average value as the filter mode. /b11> Next, select At Least and give a value to filter the rows that meet these criteria.
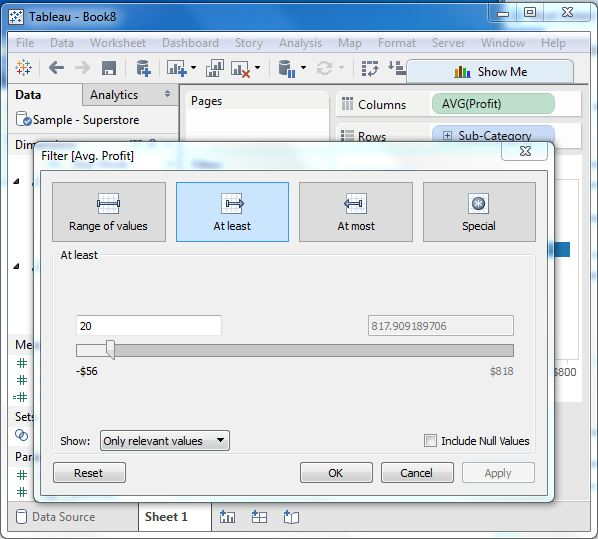
After completing the above steps, we get the final view, showing only subcategories with an average profit greater than 20.
Filter the date
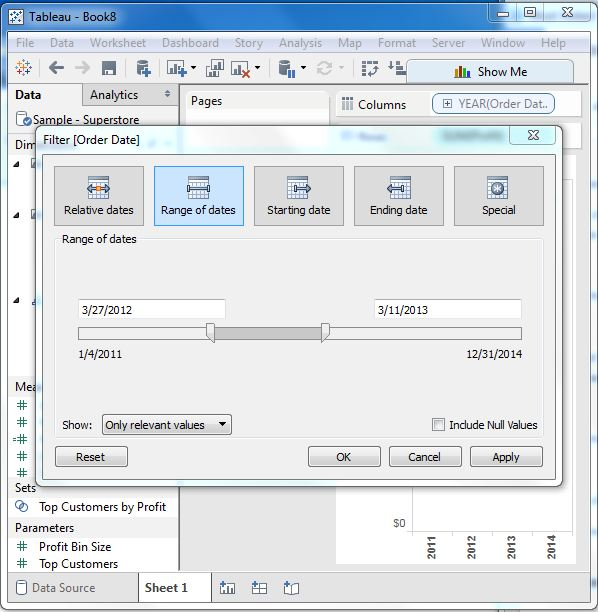
Tableau processes date fields in three different ways when they are applied. /b10> It can apply filters by taking relative dates, absolute dates, or date ranges compared to today. /b11> This option appears when the date field is dragged out of the filter pane.
Example
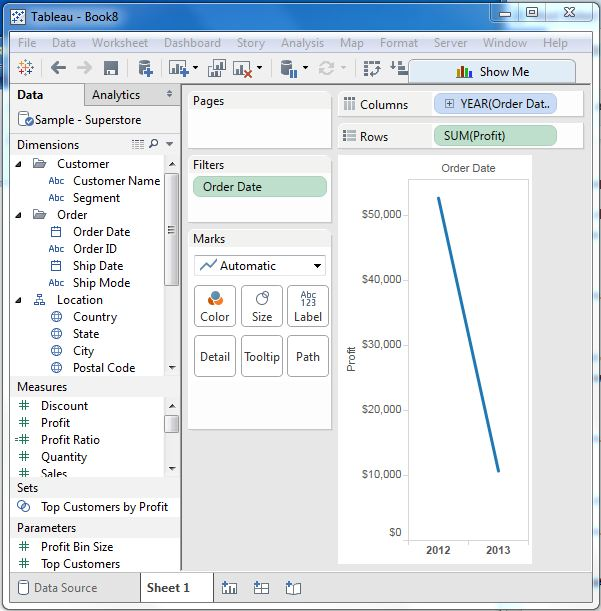
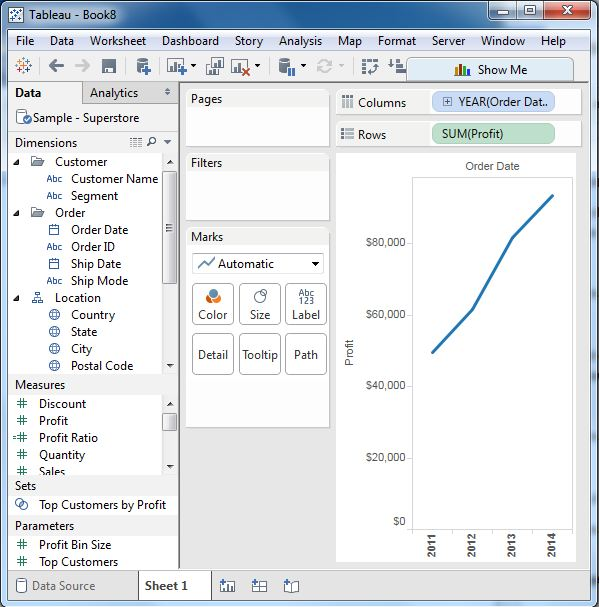
We select the sample - superstore the data source and create a view where the order date in the column shelf and the profit in the shelf are shown below.
Next, drag the Order Date field to the filter shelf, and then select the date range in the filter dialog box. /b10> The selection date is shown below.
When you click OK, the results of the selected date range are displayed below the final view.