Tableau crosstases
May 26, 2021 Tableau
Table of contents
A crosstabb chart in a table, also known as a text table, displays data as text. /b10> A chart consists of one or more dimensions and one or more measures. /b11> The chart can also display various calculations of the values of the measure field, such as run totals, total percentages, and so on.
Simple crosstases
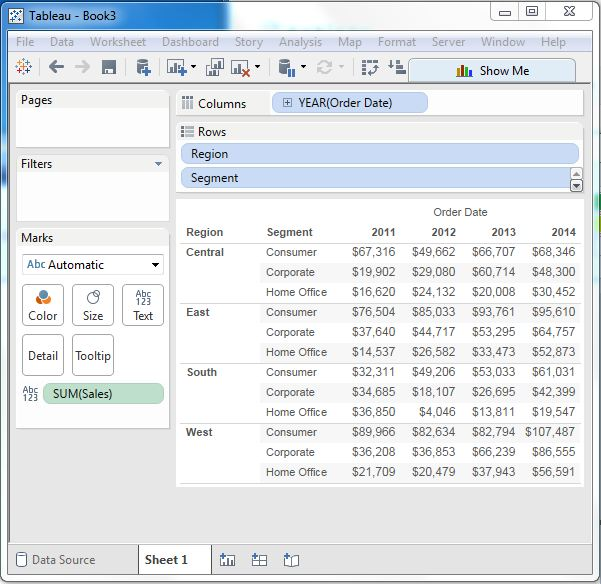
With TheSample-superstore, we plan to get sales for each segment in each region. /b10> We need to display this data for each year using the available order dates. /b11> To achieve this, we follow these steps.
- Step 1 Drag and drop dimension order dates into column boxes.
- Step 2 Drag and drop dimension areas and segments onto the row shelf.
- Step 3 Drag the measure Sales to the label Shell under the tag.
The chart below shows the crosstases
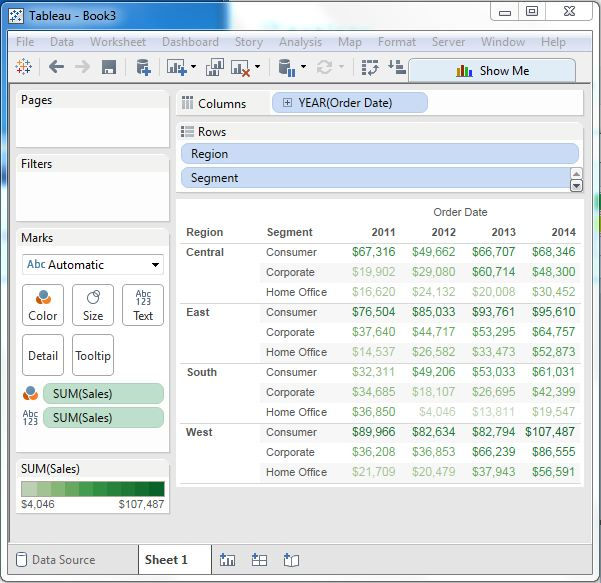
Crosstap - Color coding
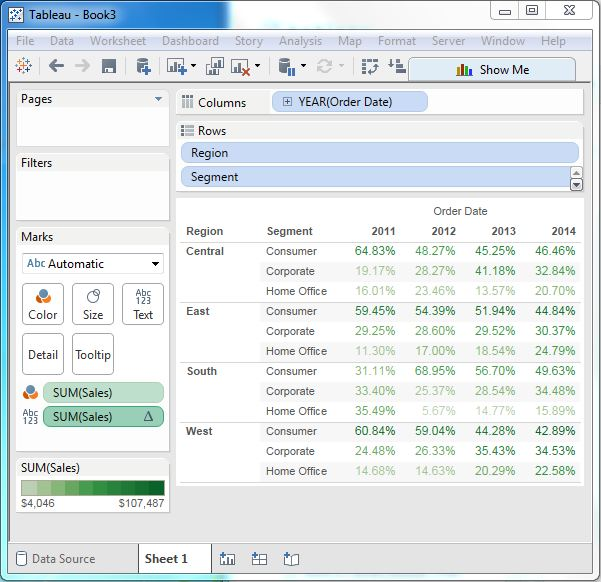
We can get the color-coded values in the crosstace chart by putting the measure field in the color stand, as shown below. /b10> This color encoding shows the intensity of the color based on the value of the measure. /b11> Larger values have darker tones than lighter values.
A crosstab with a percentage of rows
In addition to color coding, we can also get calculations that are applied to values. /b10> In the example above, we apply calculations to find the percentage of sales per row, not just sales. /b11> To do this, we right-click SUM (Sales) in the tag card, and then select the Add Table calculation option. /b12> Then we select the percentage of the total and summarize it into a table (landscape).
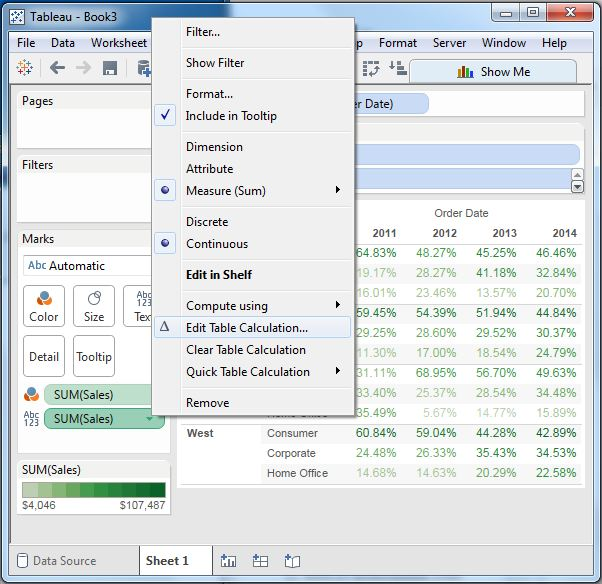
Click OK on the screen above, and we find a crosstass chart created with a percentage value, as shown below.