Tableau design process
May 26, 2021 Tableau
Table of contents
Because Tableau helps us analyze large amounts of data over many time periods, dimensions, and measures, it takes very careful planning to create a good dashboard or story. /b10> So it's important to know how to design a good dashboard. /b11> Like any other area of human ende work, there are many best practices to follow to create good worksheets and dashboards.
While the expected end result from the Tableau project is an ideal dashboard with a story, there are many intermediate steps that need to be completed to achieve this goal. /b10> The following is the design step process that should be followed ideally when creating an effective dashboard.
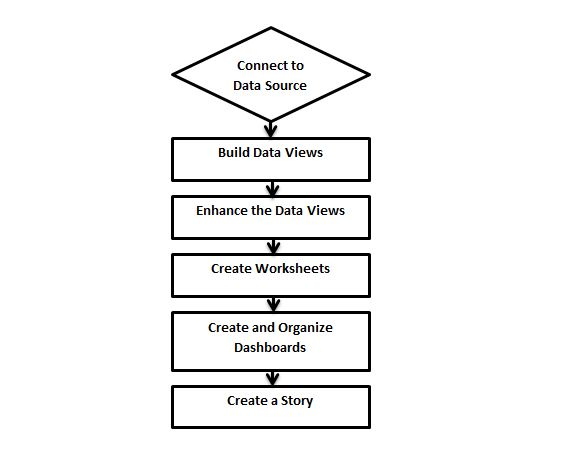
Connect to a data source
Tableau connects to all commonly used data sources. /b10> It has a built-in connector and is responsible for establishing the connection after the connection parameters are provided. /b11> Whether it's a simple text file, a relationship source, no Sql source, or a cloud database, tableau connects to almost all data sources.
Build a view of the data
When you connect to a data source, you get all the columns and data available in the Tableau environment. /b10> You can divide them into dimensions, measure, and create any desired hierarchy. /b11> With these, the views you build are traditionally referred to as reports. /b12> Tableau provides easy drag-and-drop capabilities to build views.
Enhanced view
The views created above need to be further enhanced using filters, aggregations, axis labels, colors, and border formats.
Create a worksheet
We create different worksheets to create different views of the same data or different data.
Create and organize dashboards
The dashboard contains multiple worksheets that link to it. /b10> Therefore, any action in the worksheet can change the results in the dashboard accordingly.
Create a story
A story is a worksheet that contains a series of worksheets or dashboards that work together to convey information. /b10> You can create stories that show how facts connect, provide context, demonstrate how decisions are relevant to results, or just make compelling cases.