Tableau peddle workbook
May 26, 2021 Tableau
Table of contents
A peddle workbook is used to save a view of data for different dimensions or measures on different pages. /b10> A common example is to see how each type of product executes against each other in a particular sales area. /b11> Because the values for each product type are stored as separate pages, we can view one value at a time or treat them as a range of values.
Create a peddle workbook.
A peddle workbook contains a worksheet that places fields in a page shelf. /b10> Let's consider an example of studying the profits of various sub-products in different regions. /b11> To do this, we follow these steps.
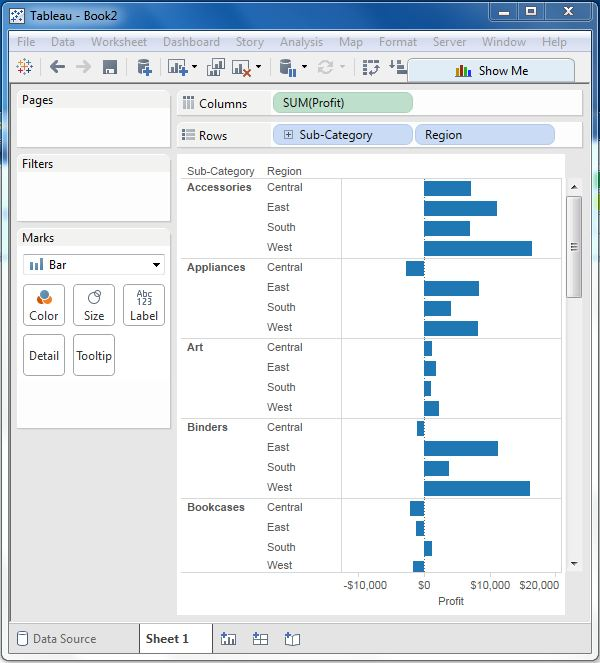
Step 1
Create a bar chart with two dimensions and one measure. /b10> In our example, we drag the measure profit to the column frame, and the dimension subcategories and regions drag to the row frame, as shown in the following illustration.
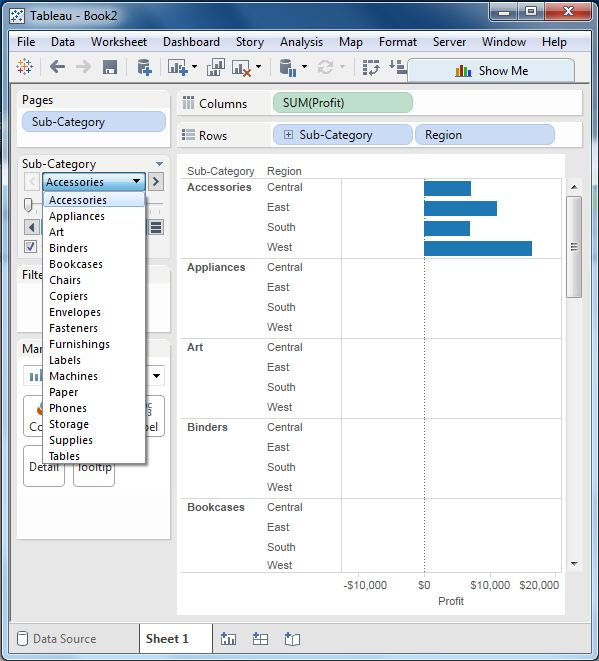
Step 2
Drag the Sub-Category field again to the page frame. /b10> We'll see the page controls automatically added below the page frame. This page control provides the following features to navigate through the pages in the view:
- Jump to a specific page
- Advance the page manually
- Push the page automatically
In our example, we'll see how to jump to a specific page and how to get automatic display of the page. /b10> To go to a specific page, click the drop-down menu on the page control, and then select the attachment. /b11> The following image appears.
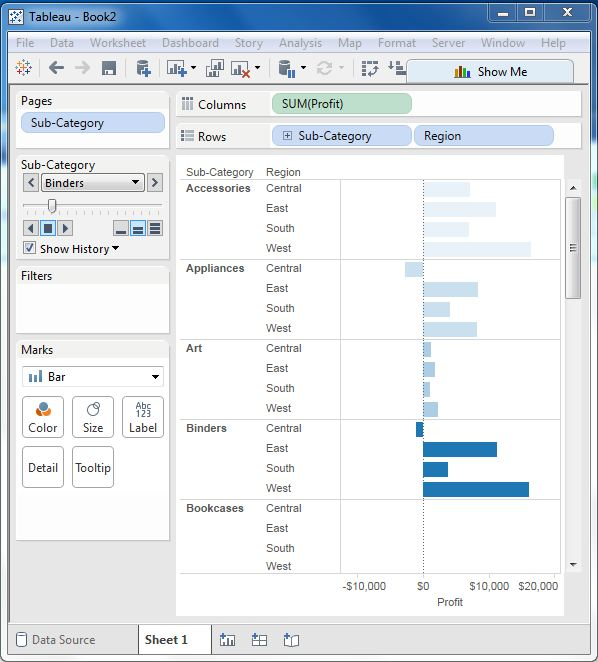
Step-3
For the auto-display page, we keep the display history check box ticked, and then clicked the play button. /b10> You can then see automatic playback of subcategories of different pages. /b11> Although the current subcategory value appears dark, the previous value is shaded in a light color. /b12> The following illustration illustrates this.