Tableau format
May 26, 2021 Tableau
Table of contents
Tableau has a variety of formatting options to change the appearance of the visualization you create. /b10> You can modify almost every aspect, such as fonts, colors, sizes, layouts, etc. Y ou can format content and containers, such as tables, axis labels, workbook topics, and so on.
The following image shows the format menu that lists the options. /b10> We'll cover some common formatting options.
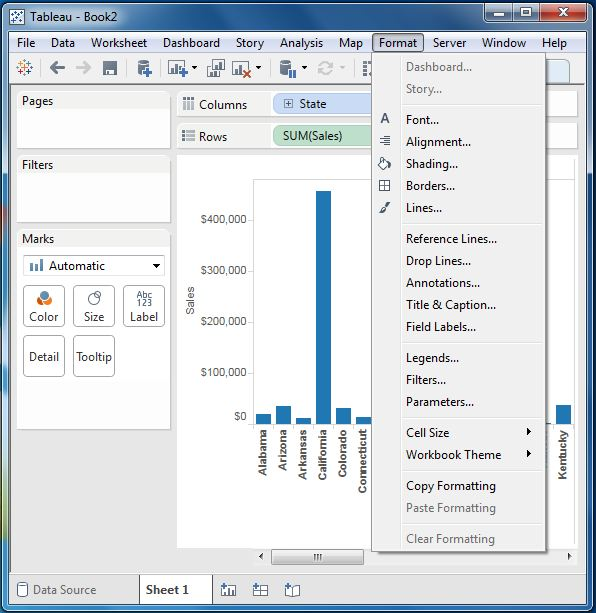
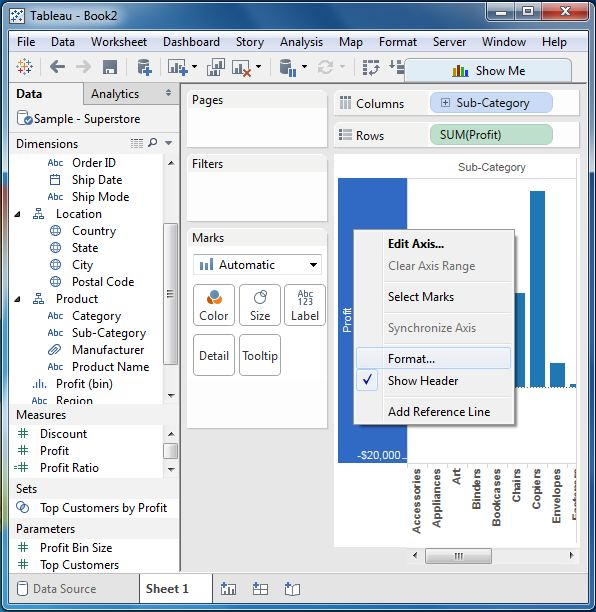
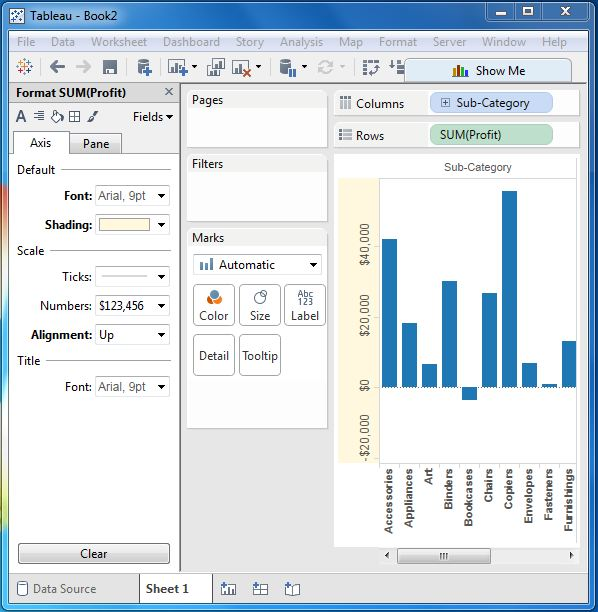
Format the axis
Let's create a simple bar chart by dragging and droping dimension subcategories into column shelves and measuring profit into row shelves. /b10> Click the vertical axis and highlight it. /b11> Then right-click it and select the format.
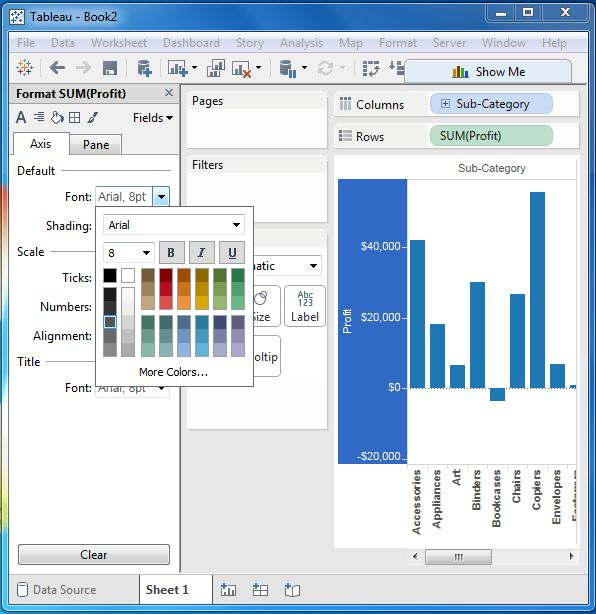
Change the font
Click the font drop-down menu in the format bar that appears on the left. /b10> We chose the font type Ariel, which is 8pt in size. /b11> It looks like this.
Change the shadow and alignment
Next, we can change the direction of the values in the axis and the shadow color, as shown below.
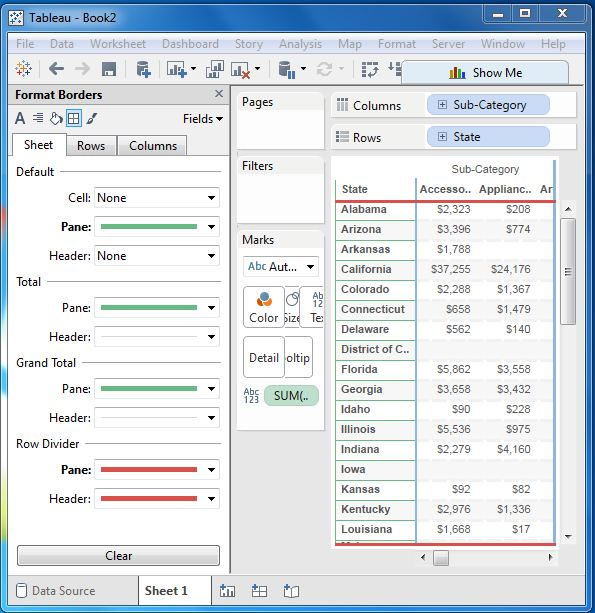
Format border
Let's look at a crosstab chart that contains subcategories in column shelves and status in row shelves. /b10> Now we can change the border of the crosstas table created with the formatting option. /b11> Right-click the crosstase chart and select Format.
The format border appears in the left pane. /b10> Select the option shown below.