jQuery EasyUI Data Grid - Format columns
May 09, 2021 jQuery EasyUI
Table of contents
jQuery EasyUI Data Grid - Format columns
The following instance formats the column data in easyui DataGrid and uses the custom column formatter, and if the price is less than 20, the text turns red.
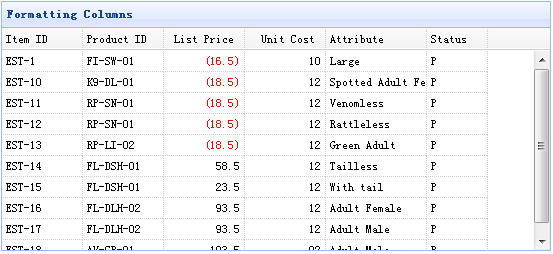
In order to format a DataGrid column, we need to set the formatter property, which is a function. This formatted function contains three parameters:
- value: The current column corresponds to the field value.
- Row: The current row records the data.
- index: The current line underrug.
Create a data grid (DataGrid)
	<table id="tt" title="Formatting Columns" class="easyui-datagrid" style="width:550px;height:250px" url="data/datagrid_data.json" 	     singleSelect="true" iconCls="icon-save">
		<thead>
			<tr>
				<th field="itemid" width="80">Item ID</th>
				<th field="productid" width="80">Product ID</th>
				<th field="listprice" width="80" align="right" formatter="formatPrice">List Price</th>
				<th field="unitcost" width="80" align="right">Unit Cost</th>
				<th field="attr1" width="100">Attribute</th>
				<th field="status" width="60" align="center">Stauts</th>
			</tr>
		</thead>
	</table>
Note that the 'listprice' field has a 'formatter' property that indicates the formatting function.
Write formatting functions
	function formatPrice(val,row){
		if (val < 20){ 	return '<span style="color:red;">('+val+')</span>';
		} else {
			return val;
		}
	}