SAS standard deviation
May 27, 2021 SAS
Table of contents
Standard deviation (SD) is a measure of how the data in the data set changes. M athematically, it measures the distance or proximity of each value to the average of the dataset. A standard deviation value close to 0 indicates that the data point tends to be very close to the average of the dataset, and a high standard deviation indicates that the data point expands over a wider range of values.
In SAS, SD values are measured using PROC MEAN and PROC SURVEYMEANS.
Use PROC MEANS
To measure the SD using proc, we select the STD option in the PROC step. I t outputs SD values for each numeric variable that exists in the data set.
Grammar
The basic syntax for calculating standard deviations in SAS is:
PROC means DATA = dataset STD;
Here is a description of the parameters used:
- Dataset is the name of the dataset.
Cases
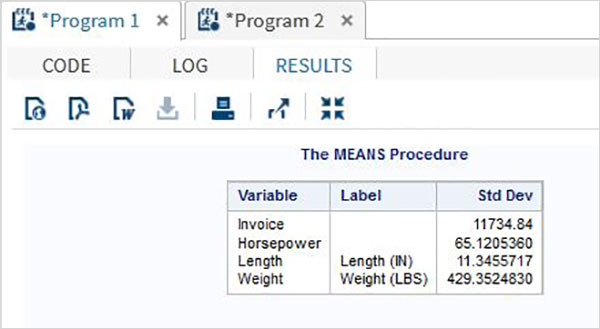
In the following example, we create a dataset, CARS1, from the CARS dataset in theASHELP library. W e select the STD option with proC mean step.
PROC SQL;
create table CARS1 as
SELECT make,type,invoice,horsepower,length,weight
 FROM
SASHELP.CARS
WHERE make in ('Audi','BMW')
;
RUN;

proc means data=CARS1 STD;
run;
When we execute the code above it provides the following output:
Use PROC SURVEYMEANS
The program is also used to measure SD and some advanced features, such as measuring the SD of a classification variable and providing an estimate of variance.
Syntactic
The syntax for USPROC SURVEYMEANS is:
PROC SURVEYMEANS options statistic-keywords ;
BY variables ;
CLASS variables ;
VAR variables ;
The following is a description of the parameters used:
- BY represents the variable used to create the observation group.
- CLASS represents the variable used to classify variables.
- The VAR indicates that the variable for the SD will be calculated.
Cases
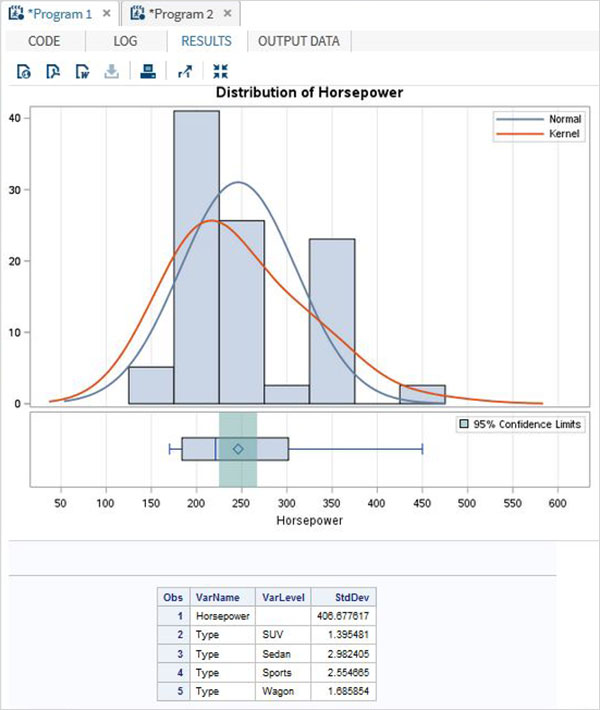
The following example describes using the class option to create statistics for each value in a class variable.
proc surveymeans data=CARS1 STD;
class type;
var type horsepower;
ods output statistics=rectangle;
run;
proc print data=rectangle;
run;
When we execute the code above it provides the following output:
Take advantage of the options
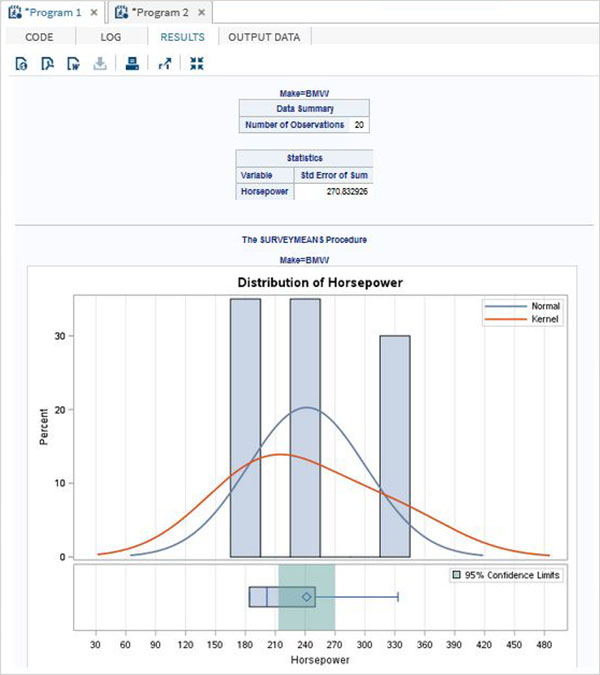
The following code gives an example of the BY option. I n it, the results are grouped by each value of the BY option.
Cases
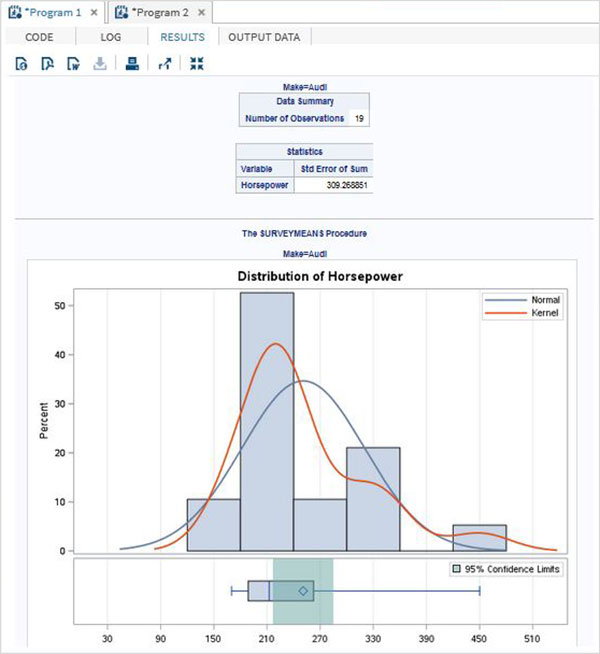
proc surveymeans data=CARS1 STD;
var horsepower;
BY make;
ods output statistics=rectangle;
run;
proc print data=rectangle;
run;
When we execute the code above it provides the following output:
make the result of "Audi"
make the result of "BMW"