SAS box chart
May 27, 2021 SAS
Table of contents
A box chart is represented by a graph of its four-digit numeric data group. A
box chart has a line that extends vertically from the box (the crystal, indicating changes outside the upper and lower quarteriles). T
he bottom and top of the box are always the first and third quarters, and the straps in the box are always the second quarters (median).
In SAS, create a simple box
plot using PROC SGPLOT and a panelling box chart using PROC SGPANEL.
Note that in the first example, we create a dataset named CARS1 and use the same dataset for all subsequent datasets.
This dataset remains in the working library until the end of the SAS session.
Syntactic
The basic syntax to create a box chart in SAS is:
PROC SGPLOT  DATA=DATASET;
  VBOX VARIABLE / category = VARIABLE;
RUN;

PROC SGPANEL  DATA=DATASET;;
PANELBY VARIABLE;
  VBOX VARIABLE> / category = VARIABLE;
RUN;
The following is a description of the parameters used:
- DATASET is the name of the dataset used.
- VARIABLE is the value used to draw Boxplot.
Simple box diagram
In a simple box-line diagram, we select one variable from the data set and another variable to form a category. T he values of the first variable are classified as as many groups as the number of different values in the second variable.
Cases
In the following example, we select the variable horsepower as the first variable and type the category variable. T herefore, we get a box chart of the distribution of horsepower values for each type of car.
PROC SQL;
create table CARS1 as
SELECT make,model,type,invoice,horsepower,length,weight
 FROM
SASHELP.CARS
WHERE make in ('Audi','BMW')
;
RUN;

PROC SGPLOT  DATA=CARS1;
  VBOX horsepower
  / category = type;

   title 'Horsepower of cars by types';
RUN;
A box line diagram in a vertical panel
We can divide the Boxplots of a variable into many vertical panels (columns). E ach panel contains a box chart of all classification variables. H owever, the box diagram is further grouped using another third variable, which divides the diagram into panels.
Cases
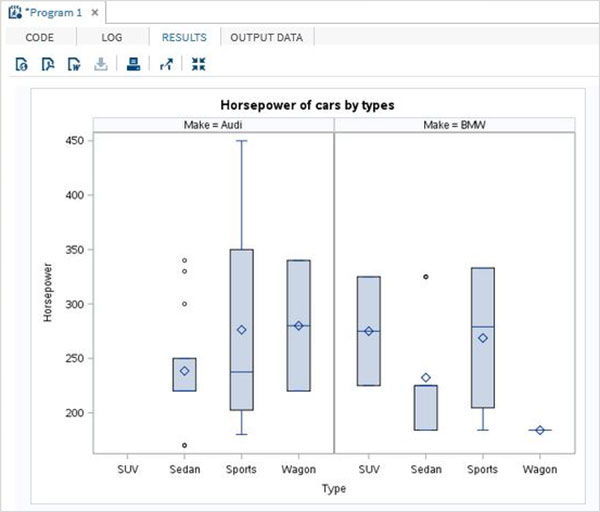
In the following example, we use the variable 'make' to draw a graph. B ecause 'make' has two different values, we get two vertical panels.
PROC SGPANEL  DATA=CARS1;
PANELBY MAKE;
  VBOX horsepower   / category = type;

   title 'Horsepower of cars by types';
RUN;
When we execute the above code, we get the following output:
A box chart in a horizontal panel
We can divide boxplots of a variable into many horizontal panels (rows). E ach panel contains a box chart of all classification variables. H owever, the box diagram is further grouped using another third variable, which divides the diagram into panels. I n the following example, we use the variable 'make' to draw a graph. B ecause 'make' has two different values, we get two horizontal panels.
PROC SGPANEL  DATA=CARS1;
PANELBY MAKE / columns = 1 novarname;

  VBOX horsepower   / category = type;

   title 'Horsepower of cars by types';
RUN;