The local timeline for js data visualization battles
May 30, 2021 Article blog
Table of contents
Background requirements
Charting with D3 usually draws an axis, but students who have drawn with D3 know that the axis scale drawn with acquiescence is in English. B
ut the scale we want is Chinese. H
ow do you do that? A
nd look at how this article teaches you how to draw a local timeline.
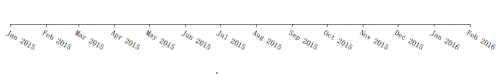
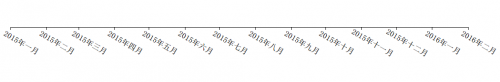
Draw the effect
How effective is it? Take a quick look!
Default formatting:
d3.time.format("%b %Y")
Local formatting:
ZH.TimeFormat ("% y year% b")
Realize the idea
The idea is simple:
The definition Chinese Simplified localized
Format the scale value of the number axis with the local time format function
Key technologies
Define new Chinese Simplified localization
// Simplified Chinese text
var zh = d3.locale({ decimal: ".", thousands: ",", grouping: [3], currency: ["¥", ""],
dateTime: "%a %b %e %X %Y",
Date: "% y /% - m /% - D", Time: "% h:% m:% s", Periods: ["Morning", "afternoon"],
Days: [Sunday "," Week 1 "," Sunday 2 "," Week 3 "," Week 4 "," Week 5 "," Week 6 "],
Shortdays: [Sunday "," Week 1 "," Sunday 2 "," Week 3 "," Week 4 "," Week 5 "," Week 6 "],
MONTHS: ["Jan", "February", "March", "April", "May", "June", "July", "August", "September", "10"" "" "101", "10 mil"],
Shortmonths: ["Jan", "February", "March", "April", "May", "June", "July", "August", "September", "10""" "" "" "" "" "" "");
Define the time scale bar
// Time scale VAR Timescale = D3.Time.scale () .domain ([New Date (2015, 0, 1), New Date (2016, 1, 1)]) .range ([0, Width-40]);
Specify the scale ruler and formatting function of the axis
// Time axis var Axis = D3.Svg.Axis () .scale (Timescale) .tickformat (zh.timeformat)) // Specifies the local format function .orient ("bottom")
Draws a number of axes
// Add Timeline Var SVG = D3.Select ("Body"). Append ("SVG") .attr ("Width", Width + 200) .attr ("Height", Height) .append ("g").attr ("Class", "Axis") .attr ("Transform", "" + 20 + "," + Height / 2 + ")") ") .call (Axis);
Adjust the scale style
// Rotate text D3.Selectall (G.Tick text) .at (Transform, Translate (30, 20) Rotate (30))
This example is very simple, you can use the following code to test the effect, have you learned?
Full code
<meta charset="utf⑻">
<style> body{ font-weight:bold; }
.axis path,
.axis line { fill: none; stroke: #000; shape-rendering: crispEdges; }
</style>
<body>
<script src="../../d3.js"> <script>
// Simplified Chinese text
var zh = d3.locale({ decimal: ".", thousands: ",", grouping: [3], currency: ["¥", ""],
dateTime: "%a %b %e %X %Y", date: "%Y/%-m/%-d",
time: "%H:%M:%S",
Periods: ["AM", "afternoon"],
Days: [Sunday "," Week 1 "," Sunday 2 "," Week 3 "," Week 4 "," Week 5 "," Week 6 "],
Shortdays: [Sunday "," Week 1 "," Sunday 2 "," Week 3 "," Week 4 "," Week 5 "," Week 6 "],
MONTHS: ["Jan", "February", "March", "April", "May", "June", "July", "August", "September", "10"" "" "101", "10 mil"],
Shortmonths: ["Jan", "February", "March", "April", "May", "June", "July", "August", "September", "10""" "" "" "" "" "" "");
// svg wide, high
var width = 1000,height = 500;
// Time scale
var timeScale = d3.time.scale() .domain([new Date(2015, 0, 1), new Date(2016, 1, 1)]) .range([0, width-40]);
// Timeline
VAR axis = d3.svg.axis () .scale (Timescale) .tickformat (zh.timeformat)) .orient ("bottom")
// Add time axis
var svg = d3.select("body").append("svg") .attr("width", width+200) .attr("height", height) .append("g") .attr("class", "axis") .attr("transform", "translate(" + 20 + "," + height/2 + ")") .call(axis);
// Rotate the text
d3.selectAll(g.tick text).attr(transform,translate(30,20)rotate(30)) script>
You can see more examples of JavaScript
and instances of JavaScript objects