ASP.NET debugging
May 13, 2021 ASP.NET
Table of contents
Debugging
Debugging lets developers see step by step how the code works, how the values of variables change, how objects are created, how they are destroyed, and so on.
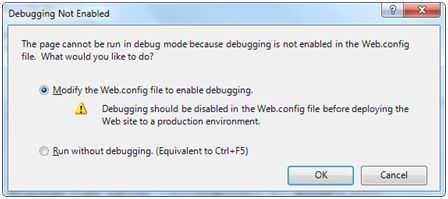
When a web page is run for the first time, Visual Studio pops up a prompt box asking if Debugging needs to be enabled:
When debugging is enabled, the following lines of code appear in the web.config file:
<system.web>
<compilation debug="true">
<assemblies>
..............
</assemblies>
</compilation>
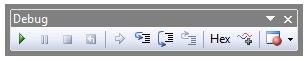
</system.web> The Debugging toolbar provides all the tools debugging needs:
Breakpoint
A break point specifies that a program stops running as soon as it runs a specified line of code, so that it can test the code and do a variety of debugging tasks, such as observing changes in variable values, step-by-step debugging code, jumping in and out of function methods, and so on.
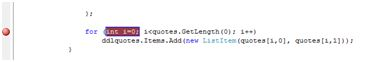
Right-click on the code to insert a break point to set the break point. T
hen a red dot appears on the left and the line of code is highlighted, as shown in the image:
After you run this code, you will observe the behavior of the break point.
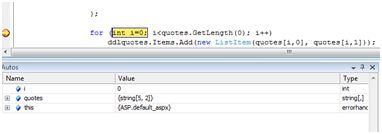
At this stage, you can step through the code and observe the running process and variable values, properties, objects, and so on.
If you need to modify the break point property, you can right-click on the break point flag and find it in the Properties menu:
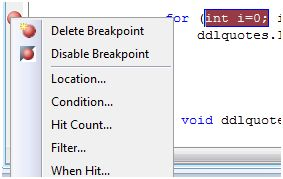
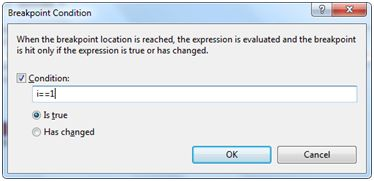
The location dialog box shows where the file is located, as well as the number of lines and characters of the code selected. T he condition menu allows you to enter a valid expression to estimate whether the program is running to a break point:
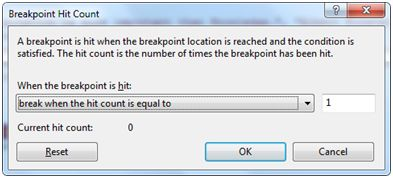
The Hit Count menu displays a dialog box showing the number of times a break point has been run.
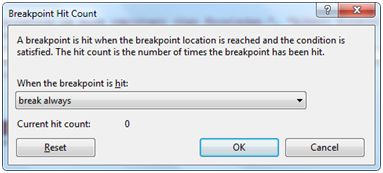
Clicking on any of the options in the drop-down menu opens an edit box for entering hits. T his is useful when analyzing the code for a loop structure.
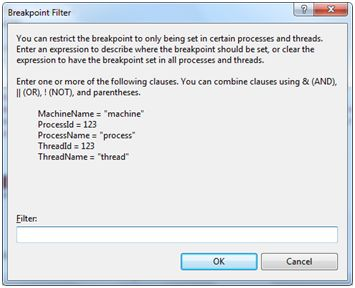
The Filter menu allows you to set up a filter on a specific mechanism, procedure, thread, or any combination so that break points take effect on them.
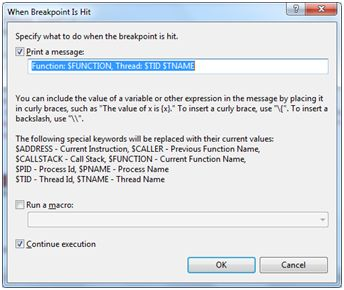
The When Hit menu allows you to specify the action when a break point hits.
Debug window
Visual Studio provides the following debug window, each of which displays some program information. T he following table lists some windows:
| Window | Describe |
|---|---|
| Direct | Displays variables and expressions. |
| Automatic | Displays all current variables and previous states. |
| Local | Displays all variables for the current context. |
| Observation | Displays variables for up to four different collections. |
| The call stack | Displays all methods in the call stack. |
| Thread | Displays and controls threads. |