Chrome Development Tools Development Workflow
May 26, 2021 Chrome A guide to developing tools
Table of contents
Develop a workflow
A developer workflow generally requires steps to achieve a goal. When the author has developer tools, this optimizes the workflow to accomplish routine tasks in less time, such as locking files or functions, continually writing scripts or style sheets, saving frequently used fragments, or simply rearranging the layout to better fit your needs.
In this section, we'll explain some tips to make your workflow more efficient when using DevTools.
Dock-To-Right provides vertical editing
You may find that developer tools provide some horizontal space at the bottom, but there is little room left vertically. T he anchor on the right allows you to place the developer tool on the right side of the window. This allows you to view the current page in the left window and place the tested things on the right side of the screen.
The benefits are:
- You may be working on a widescreen display, and you want to maximize space to examine and test your code
- You can change and separate your layout so that it is less than 400 px (the minimum size of the current Chrom) and test the adjusted layout.
- Longer scripts use vertical space for easier debugging
Navigate to a URL that you want to miss and then press and hold the button at the bottom of the developer tool's left hand side.
 Switch
between dock-to-right
and dock-to-window,
Switch
between dock-to-right
and dock-to-window,
Note: Developer tools will remember your last option, so you can switch between the two ways yourself.
This adjusts the screen to show the available layout options. Once you have selected a preference, the layout will change immediately in response to the change.
Note: Each tab has its own layout. This means that it is possible that one tab tool is on the right side of the screen and another tab is at the bottom of the window.
Search, navigate and filter
Filter a script, style sheet, or filter a fragment by file name
For a developer's workflow, it is necessary to be able to quickly locate a particular file. By using the following shortcuts, the developer tool allows you to search for all scripts, style sheets, and file fragments:
-
Ctrl+o(windows,Linux) -
Cmd+o(Mac OS X)
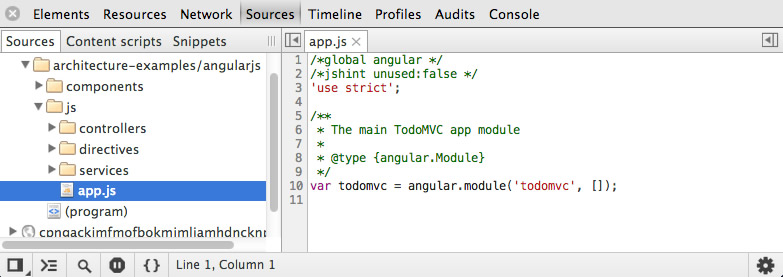
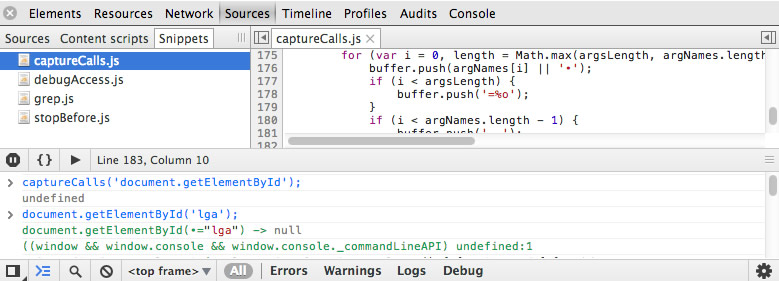
This tool is independent of the console currently in use. For the Todo app, using one of these shortcuts will take us to the Sources panel and provide a search box listing all the checkable files.
Here we can filter out a specific file (e.g. file hit contains script) or select a file, preview or edit it.
Note: In all conversations, we offer hump matches. For example, when you turn on fooBarScript.js, you can just write FBaSc, which saves you time.
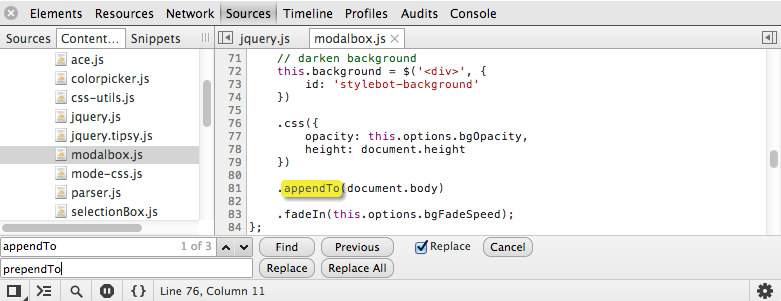
Text search in the current file
Searching for a special string in the current file can use the following shortcuts:
-
Ctrl+F(Windows,Linux) -
Cmd+F(Mac OS X)
Once you've entered a keyword into the search box, clicking Enter will take you to the first match.
Continuing to click enter will jump in the results, or you can jump
up
and down
down
buttons next to the search box.
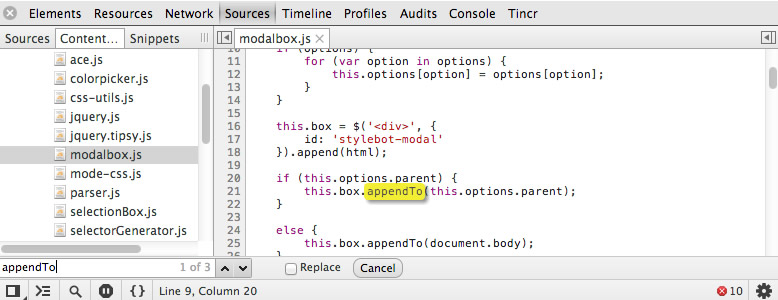
Text replacement in the current file
Developer tools support positioning text in the current file, as well as replacing individual or all text with new values. Selecting "Relpace" will result in a second input area to fill in the text for replacement.
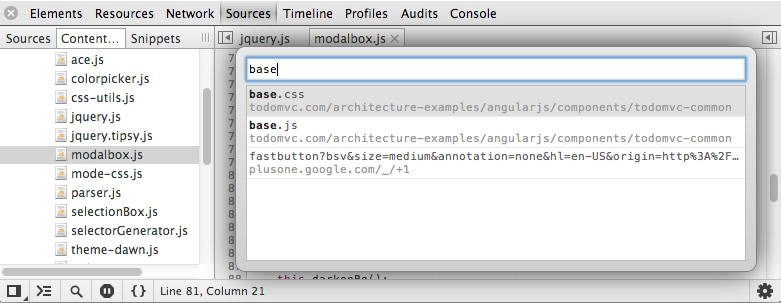
Search for text in all files
If you want to search for specific text in all loaded files, you can use the following shortcuts to load the search box interface:
-
Ctrl+Shift+F(Windows,Linux) -
Cmd+Opt+F(Mac OS X)
Both regular expressions and case-sensitive search methods are available here.
Search with regular expressions
To search with a regular expression is to fill in the expression at the search place, and then select
Regular Expression
click Enter.
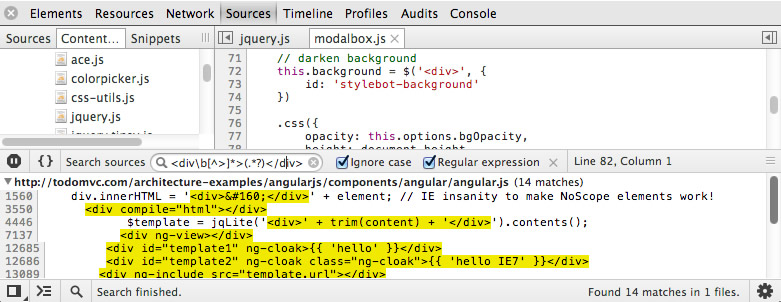
In the image above we can see how to search for all matches
Filter a function or a selector in a file
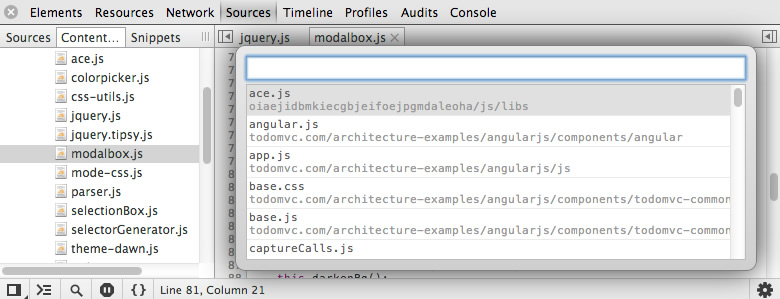
You should also want more features so that you can navigate to (or search for) special JavaScript functions or CSS rule files in a file.
To navigate to the file you selected, go to the source panel. You can then use the following shortcuts to open a selection box for a corresponding function/specific selector:
-
Ctrl+Shitf+O(Windows,Linux) -
Cmd+Shitf+O(Mac OS X)
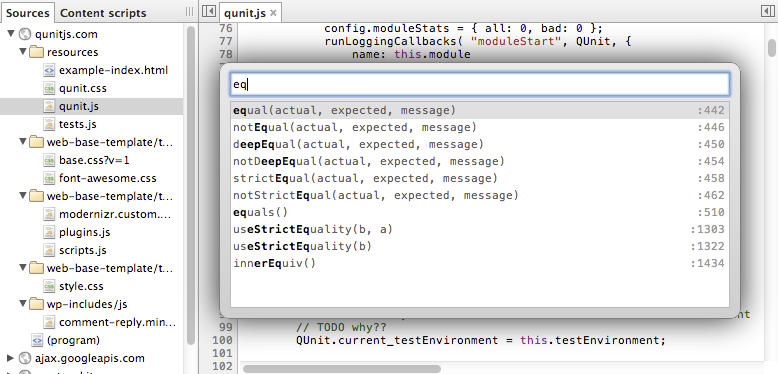
Depending on Chinese options, you'll see all JavaScript or CSS style definitions. Start typing the name of the function you want to search for or the result of a list is filtered out when you define CSS, or you can directly select a result and go into the file that defines it.
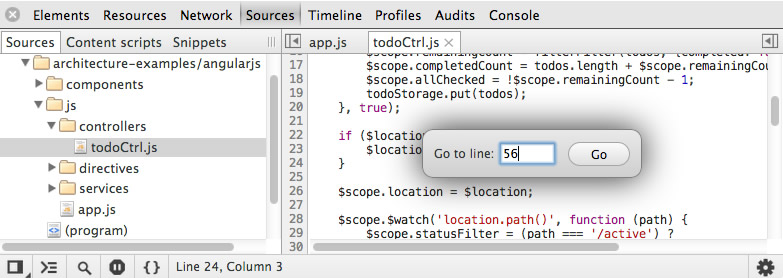
Jump to the specified line number
Developer tools can also jump directly to the specified line number in the editor. To start the line number input box, simply select the file you are looking for and use the following shortcuts to start:
-
Ctrl+L(Windows) -
Cmd+L(Mac OS X) -
Ctrl+G(Linux)
Edit scripts and styles in real time
The development tool supports real-time editing of scripts and styles, and you don't need to reload the page to see the effect. This is useful for testing design changes, native JavaScript functions, or block code blocks.
Script
JavaScript can be edited
Sources
in the Sources panel.
Open the specified script for editing, or:
-
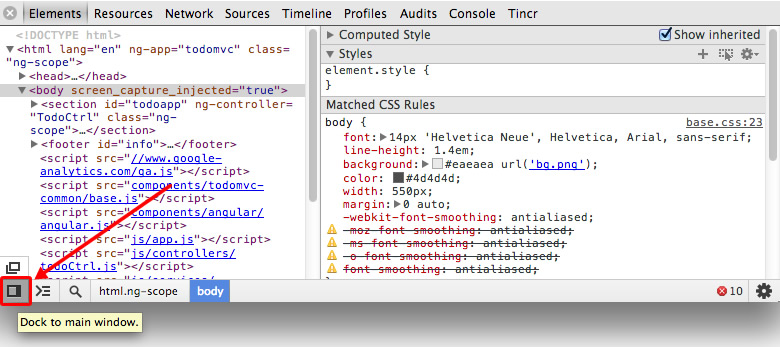
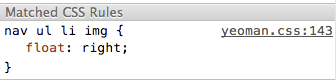
Click on the link to the script in the view of the element panel (example:
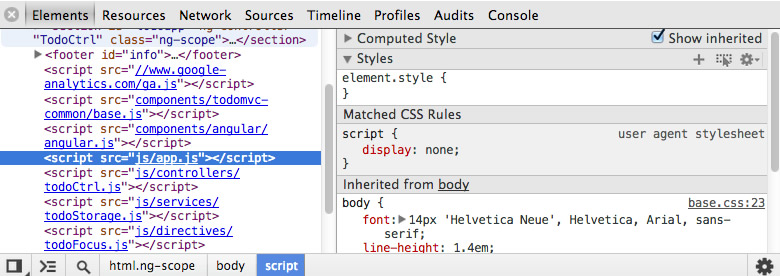
-
Or select the file name of the script from the
Scourcessub-panel:
This displays a new label on the right panel, where the source file will be syntax highlighted.
Changes to the script will only be made at the evaluation time, which means that changes to the code will have no effect if they are not made after the page is loaded. The modified code is executed at the next stage, such as when the mouse slides over the listening or clicks on the callback changes for the event.
For more information about JavaScript
Sources
in the Sources panel, contact us to read the
JavaScript Errors documentation.
You can also
view short screen intercepts and break-point misaling on the online editor.
Tip: The workspace is also supported for continuous editing of local files. See more
Style
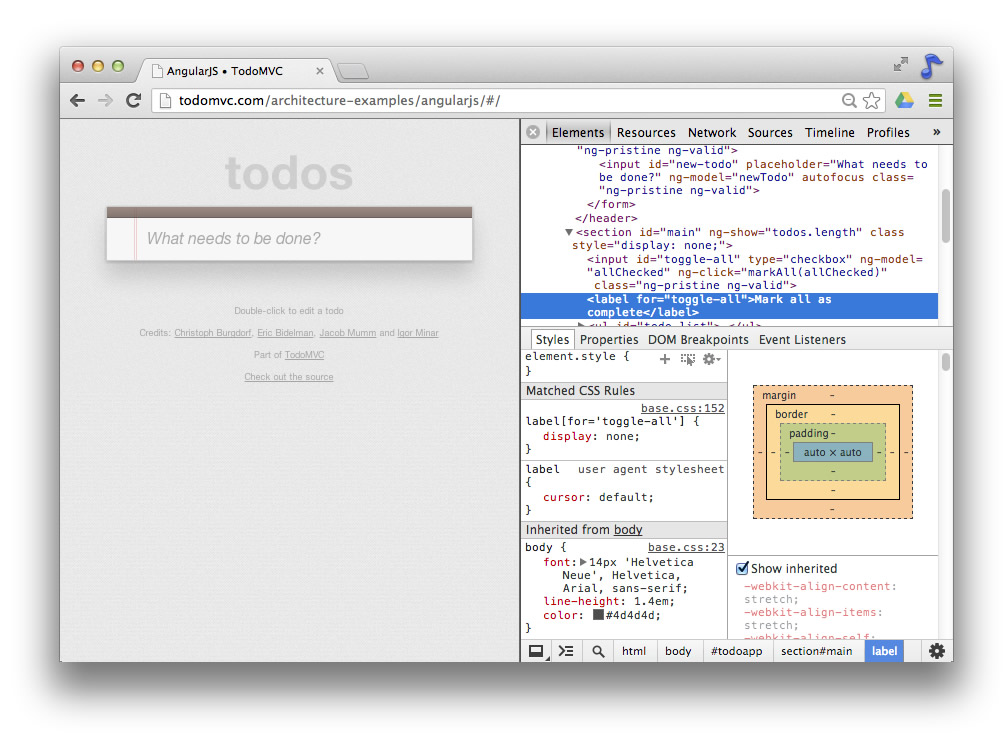
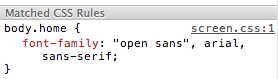
Here's a workflow with a similar editing style. O pen the developer tool and select the element panel. O n the right, some sub-panels will be displayed, including style panels. Checking that an element on the page displays a set of properties on the Style panel that have been applied to the current node and is sorted by selector.
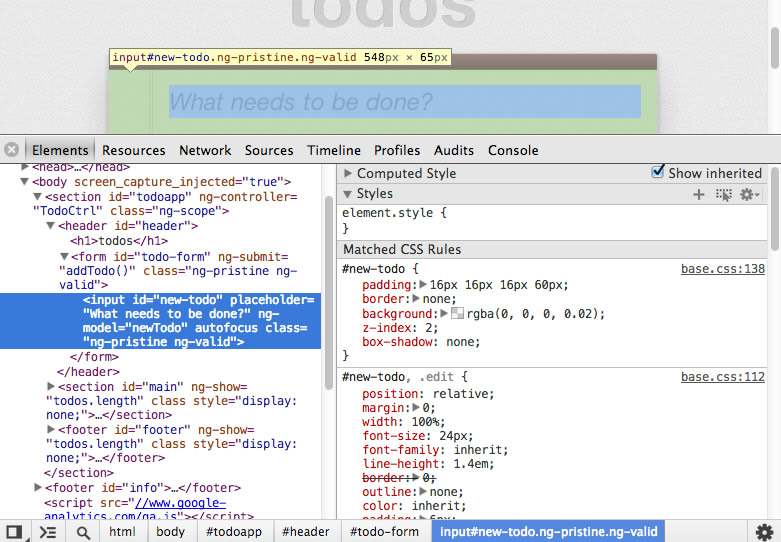
The element.style section shows the related properties set by style properties in the page tag.
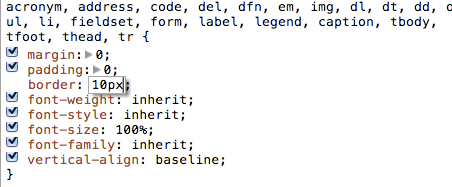
The next section is Matched CSS Rules, where selectors that match the nodes, their properties and values, even their source file names, and the line numbers that read the style are displayed. T he nodes matched by the selector will be set to black and the others will be grayed out. The biggest advantage of this is that we can better distinguish what the selectors filter out when we read.
Changing any CSS properties in a sub-panel, such as the boundaries and dimensions of an element, will take effect immediately and will be displayed in the main display window.
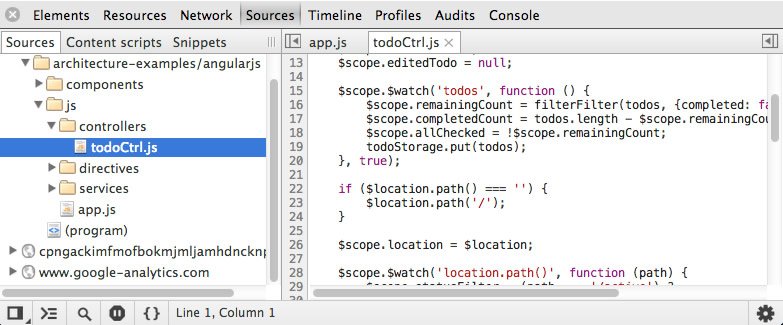
Return to the Matched CSS Rules panel and click on the link to the style sheet next to the rule to walk you to the Sources panel. This displays the complete style sheet and navigates directly to the line number of the relevant CSS rule.
Here, you can change the file to use the regular editor, and the browser displays the effect of the change in real time.
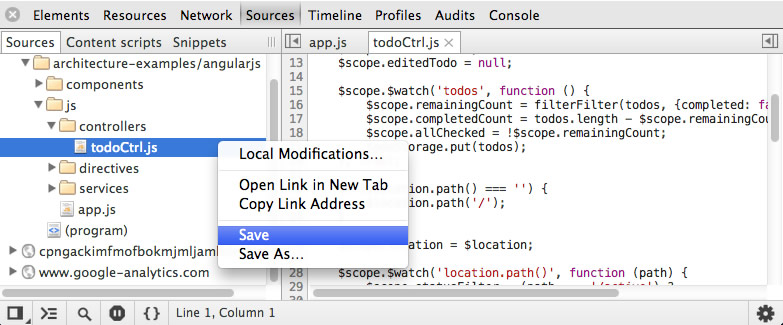
Save as
If you are satisfied with the changes you have made, you can save the file.
To do this, first confirm whether you have made changes in the text editing view under the source panel:
Or click on the file name (e.g., style/CSS) in "Element-style panle" (.css).
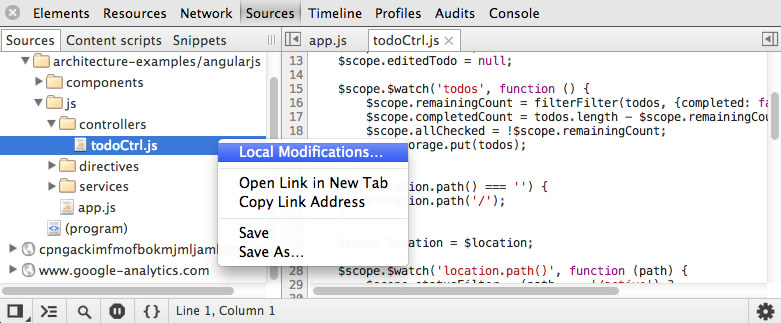
Next, right-click on the file name or simply click anywhere in the text editor, and then select Save As. This will pop up a menu that allows you to save.
Changes committed later (saved in the same menu or
Ctrl
S
are saved to the same location.
Cmd
Local modifications
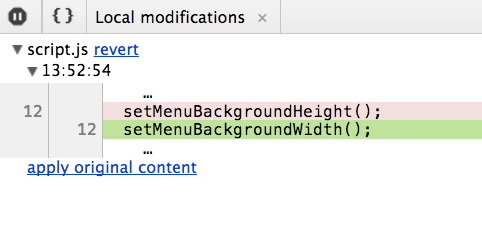
The development tool also maintains all historical modifications to local files. If you've edited a script or style sheet and saved it using a development tool, you can right-click a file name in Sources (or in the source area) and select "Local modifications" to view the history.
A local modification panel will show:
- Different changes
- The time the file was changed
- The domain name in which the modified file is located
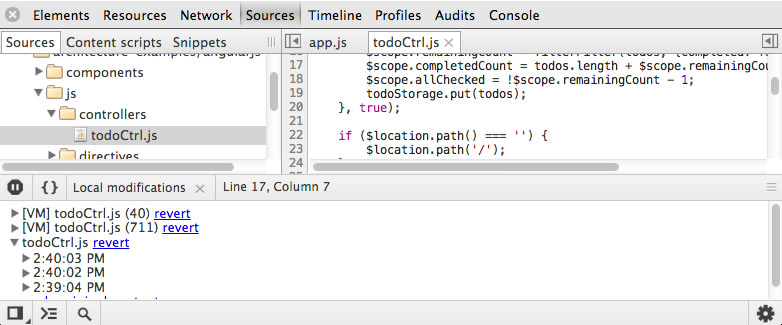
There are also links. Revert returns all changes on the file to its original state and removes the change history.
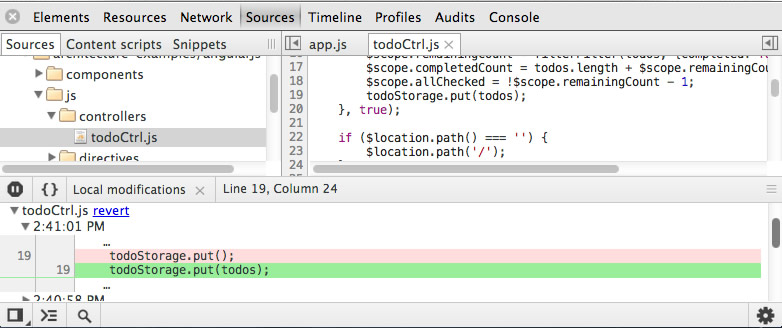
Apply original content effectively repeats the same operation, but maintains the modification history in the view so that you don't want to go back to a particular change.

Eventually, the apply version content applies all changes and provides a specific modification record on the time set.
Customize JavaScript clips
Sometimes you want to be able to save small scripts, bookmarks, and useful tools so that they can be used when debugging. 20> Snippets is a new developer tool that can be used in this development process, allowing you to create, store, and execute JavaScript in the source panel. You can now get it in Chrome Canary.
Here's what Snippets is more useful for:
- Bookmarks All your bookmarks can be stored as fragments, especially those you might want to edit.
- Utility Debug tools can interact with the current page and can be saved and debugged. A list of community plans has been provided.
- Debugging Snippets provides a syntax highlighted and sustainable multi-line console, which makes debugging code easier than a single line.
- Monkey-patching code The code you want to fix at runtime can be done with Snipptes, although most of the time you might just edit the code in real time in the source panel.
Brian Grinstead provides a place to store useful Snippets for developers, just bgrins.github.io/devtools-snippets
Begin
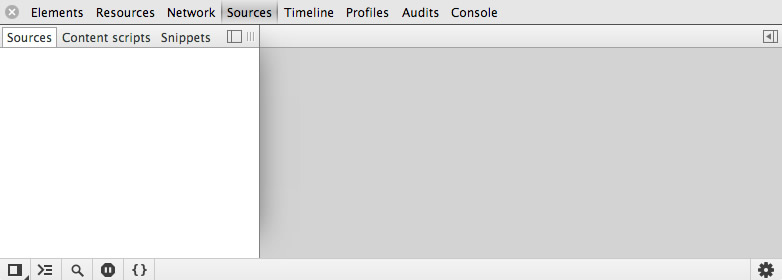
Start with Snippets and navigate to the Sources panel. If you don't make any changes, you'll see the default layout, just like this:
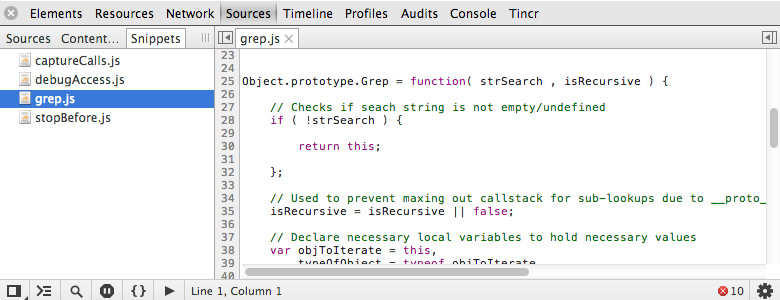
Click the toggle key in the left corner above to display the expanded panel. H ere you should have seen Sources, Content scripts and a new tag, Snippets. Click on it and go to Snippets.
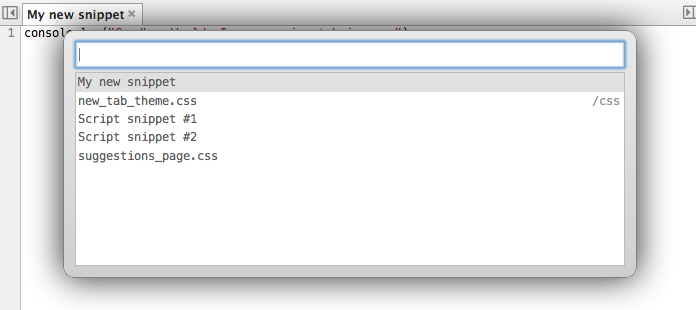
Create snippets
Snippets works through two panels. T he panel on the left (similar to Sources) is the list of files, and selecting a snippets file will open it in the editor on the right. This is similar to when you select a script or style sheet in the source panel.
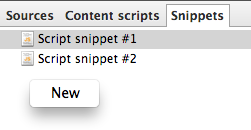
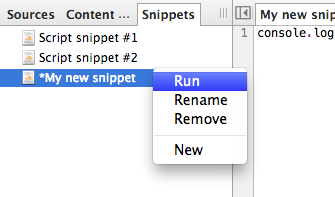
Right-clicking and selecting "New" in the list of files creates a new snippet file.
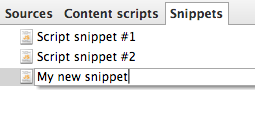
The name of the Snippet file
The Snippet file name is created automatically, but when the snippets file is created, you can also change the file name yourself.
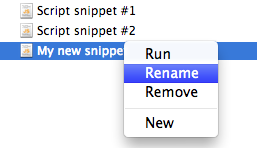
After that, if you want to change the file name again, just right-click again in the file list and select Rename. You can also choose "Remove" if you need it.
Edit and execute Snippets
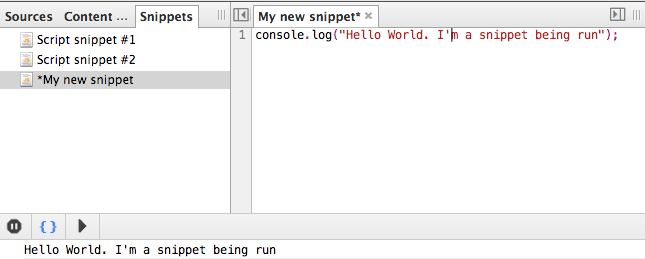
Select a Snippets file from the list of files and open it in the editor on your right. Here you can write or paste any JavaScript code (in other words, your Snippet), including functions and expressions.
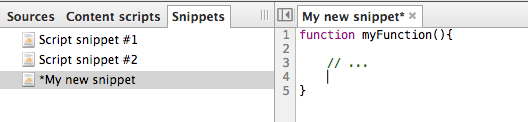
If a file name ends with , it means that the file has been modified but not saved.
To perform this Snippet, right-click on the file list, and then select Run. Or you can click on the .Run button.
If this snippet has console output, the console under the editor outputs the relevant content.
Note: You can also execute a snippet using keyboard shortcuts - check your snippet, and then run it using
Ctr/CmdplusEnterThis behaves the same as using the Run button - currently only in the Source console, but then jumps to the debugger console.
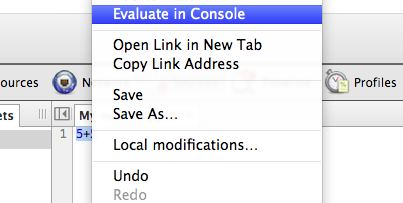
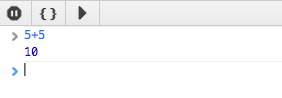
If you want to execute some special lines of code in the console, you can select the code in the editor and right-click to select the "Evaluate in Console" option to execute.
The shortcuts on the keyboard
Ctrl
Shift
E
When Run is selected, the output expression is output in the console below the editor.
Local modifications
For each Source, Snippet also supports browsing local changes and rolling back changes to a specific point in time.
After saving the changes, right-click in the editor, and then select "Local modifications" to use the feature.
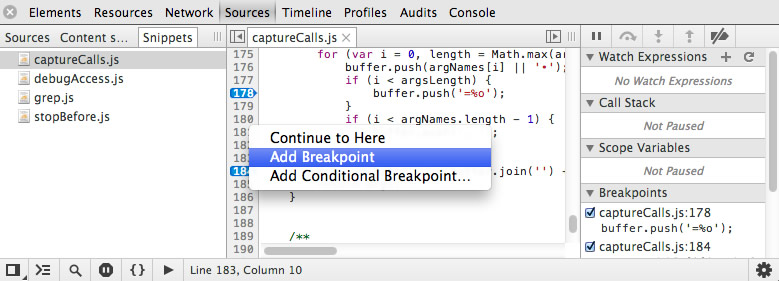
Break points, observation expressions, and more
Other features you use in the Sources panel, such as adding observation expressions, break points, collecting variables, and saving files, can also be used in Snippet.
Read this chapter of the Sources panel to learn more about these features.
Save Snippets
Snippets can be saved and can still be used later through the Snippets tab in the developer tool, or a new file can be exported directly. Right-click the edit menu in text editing to get Snippet's save options.
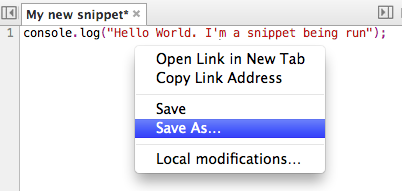
Save saves the changes to an existing Snippets file, and Save As will allow you to save the Snippets to the new file path.
Note: Snippets are stored in the local storage of the developer tool. When using Sava/Save As, you can bind this Snippets to a file anywhere, just as you would save other scripts.
Snippets navigation
Just like scripts and style sheets in Sources, Snippets can use the appropriate keyboard shortcuts we mentioned earlier, such as navigating to a specific Snippets file, function, or line number.