Chrome Development Tool Timeline example
May 26, 2021 Chrome A guide to developing tools
Table of contents
Timeline example: Diagnostics that force a synchronous layout
This example shows how to use the timeline to identify a performance bottleneck called a "forced synchronization layout." T he sample application loops through several pictures and enforces the requestAnimation Frame() method recommended when performing frame-based animations. But there's still a less-than-ideal situation when the animation is running, and we'll use the timeline to diagnose what's going on.
If you want to learn more about frame patterns and force-synchronized layouts, refer to Locating forced synchronous layouts in the Timeline section.
Make a record
First, you need to make a record of the animation:
- Click Start to start the animation.
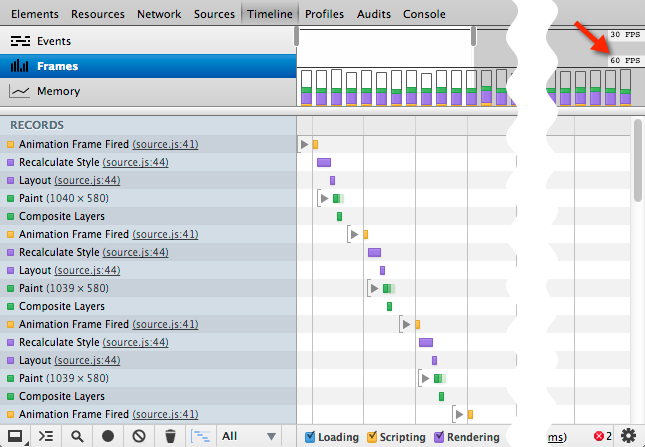
- Open the timeline panel and find the frame view.
- Click the Record button on the timeline.
- After one or two seconds (about ten to twelve frames were recorded) stop recording and click Stop to stop the animation.
Analyze the records
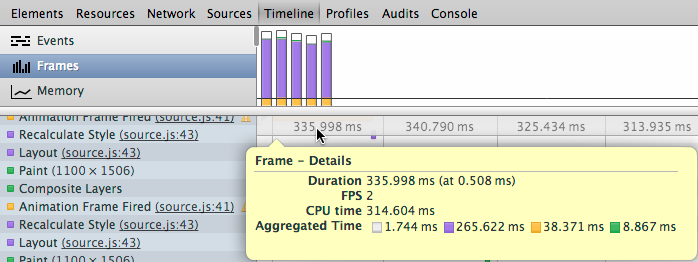
Look at the first few frames in the record, each with a full time of about 300 milliseconds. If you park your mouse over one of the frames, the browser displays the details of that frame.
Select an animation frame in the record with a yellow warning sign next to it that indicates that it is a forced sync layout. A darker icon indicates that there is a problem code in its sub-record, not a problem with the record itself, and you can expand the Animation Frame field to view its sub-record.
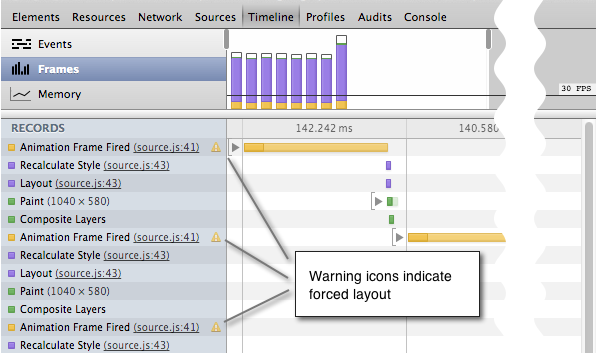
The sub-records show the length of the Recalculate Style and Layout records and the repeat pattern. E ach layout record is the result of recalculating the layout, which in turn is the result of the request Animatino Frame() processor requesting the offsetTop value for each picture on the page. Hover over one of the records and click source next to the Layout Forced property to .js connection.
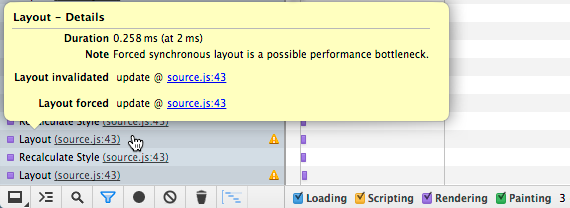
The Sources panel opens the update() method on line 43 of the source file, which is the callback processor for the requestAnimation Callback() method. T he processor calculates the left CSS style properties on the picture offsetTop. This allows Chrome to display the layout as soon as it is modified to ensure that the values it provides are correct.
// 动画循环
function update(timestamp) {
    for(var m = 0; m < movers.length; m++) {
        movers[m].style.left = ((Math.sin(movers[m].offsetTop + timestamp/1000)+1) * 500) + 'px';
    }
    raf = window.requestAnimationFrame(update);
};
Forcing the page layout to load in each animation frame slows down, and now we can try using DevTools directly to fix the problem.
App fixes within DevTools
Now that we know what's causing the performance problem, we can modify the JavaScript file directly in the Sources panel and immediately test the effect of the changes.
- In the previously opened Sources panel, replace 43 lines of code with the following code.
Validate with other records
The animation is obviously faster and smoother than before, but it would be nice to measure the difference between adjusted and other records. The specific situation should look like the following record: