WeChat Gadget Tool The three main functional areas of program debugging
May 20, 2021 WeChat Mini Program Development Document
Table of contents
There are three main functional areas for program debugging: simulator, debug tool, and small program operating area
Simulator
The emulator simulates the real logical performance of WeChat programs on the client side, and for most APIs, it can appear in the correct state on the emulator.

Compile the code
Click the compilation button in the lower left corner of the tool or use the shortcut Ctrl (Command) plus B to compile the current code and automatically refresh the simulator.
At the same time, to help developers debug specific pages or enter the scene values, as in the case of developers can choose a custom compilation mode.

Custom pre-processing
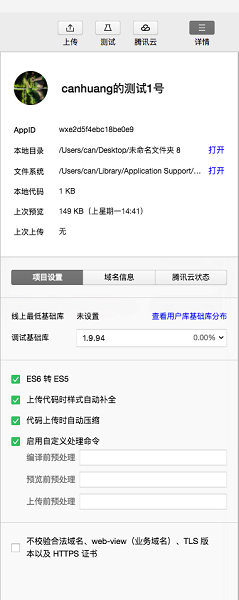
On the project setup page card, we provide the following default pre-processing to resolve most of the code file pre-processing issues
- ES6 to ES5 (can be used for compilation, preview, upload), using "babel-core": "'6.26.0'"
- Style auto-complement when uploading code, using "postcs": "
- Automatic compression when uploading code, using "uglify-js": "3.0.27"
For advanced developers, it's perfectly possible to preprocess code files by writing automated build scripts themselves, so we provide the Enable Custom Processing Commands option Developers can specify pre-compilation/pre-preview/pre-upload commands The developer tool runs the specified commands in a shell manner and outputs the execution logs of the commands in the console
Pre-processing order execution order
- Custom pre-processing command
- Default pre-processing command
- Compilation / preview / upload
Note:
- Compile the pre-processing command, you need to manually click the "Compile" button, or use the shortcut key to compile to trigger.File modification cannot trigger the command.
- The MAC version of the developer tool cannot be multiplexed in the BASH environment variable.You may need to manually set the system's path environment variable to perform the commands normally.
Debugging tool
Debug tools are divided into 7 major functional modules: WXML, Console, Sourcees, Network, Appdata, Storage, Sensor
Wxml Panel
Wxml Panel is used to help developers develop Wxml's converted interface. H ere you can see the real page structure and the wxss property corresponding to the structure, and you can see the modification in real time in the emulator by modifying the corresponding wxss property. By debugging the selector in the upper left corner of the module, you can also quickly find the wxml code for the components on the page.

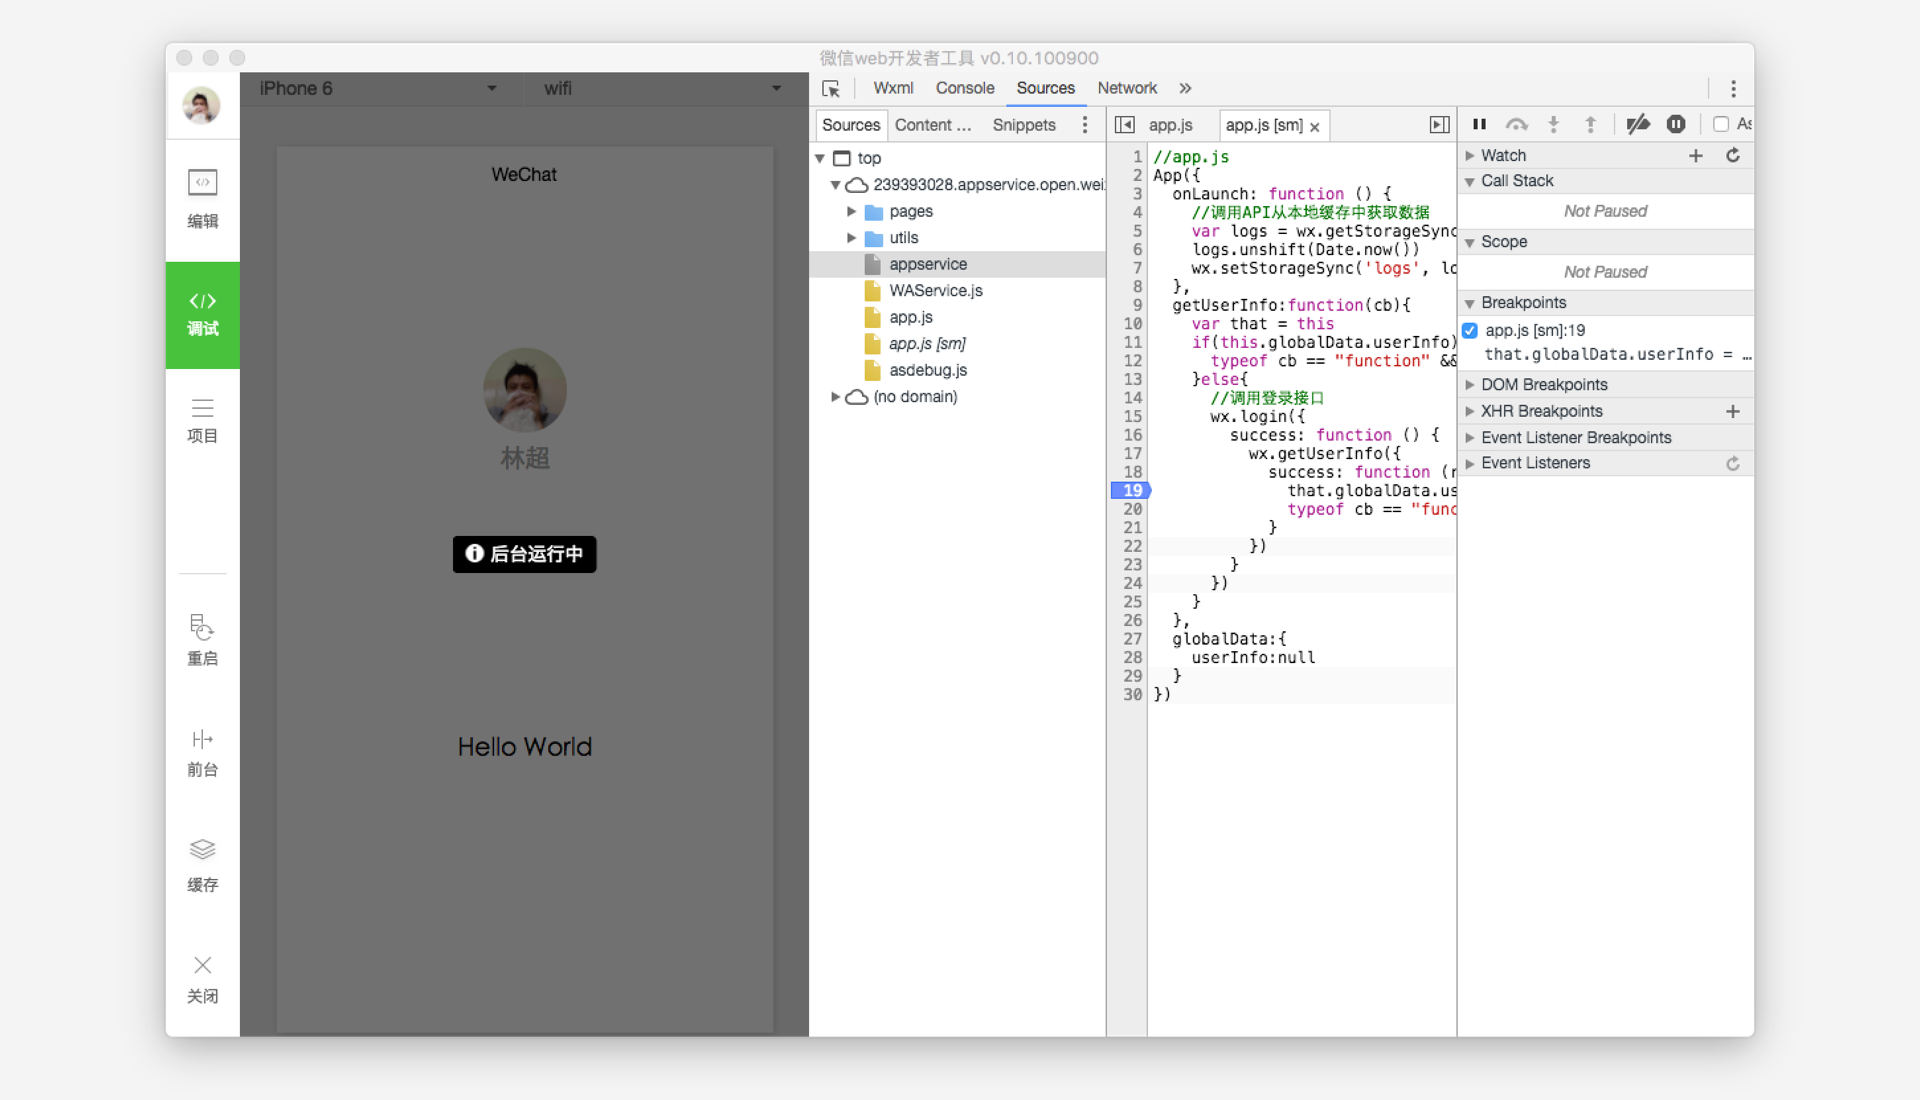
Sources panel
Sources panel is used to display script files for the current project, and, different from browser development, the WeChat mini-program framework compiles the script files, so the files seen by the developer in sources panel are processed script files, the developer's code is wrapped in the define function, and for page code, there is an active call to the back.

Network panel
Netwrok Pannle is used to observe and display requests and socket requests

Note: UploadFile and downloadFile are not supported in Network Panel for the time being
Appdata panel
Appdata panel is used to display the current moment of the project appdata specific data, real-time feedback on the project data, you can edit the data here, and timely feedback to the interface.

Storage panel
Storage panel is used to display data storage after the current project uses wx.setStorage or wx.setStorageSync.

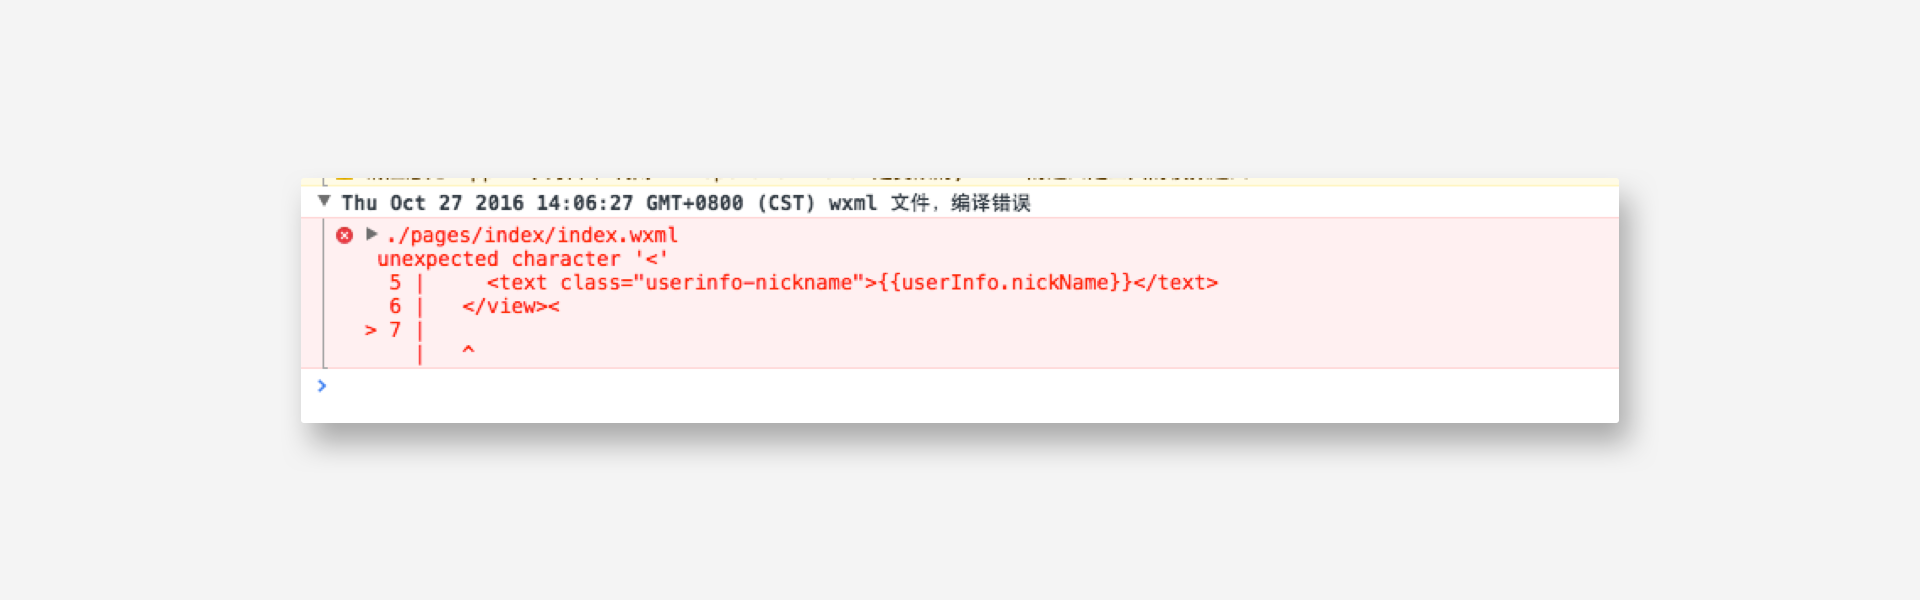
Console Pannel
Console Pannel has two major features:
-
Developers can enter and debug code here

-
The error output of the small program is shown here

Sensor panel
Sensor panel has two major features:
-
Developers can choose to simulate geographic locations here
-
Development can simulate mobile device performance here for debugging gravity sensing APIs
The small program operating area
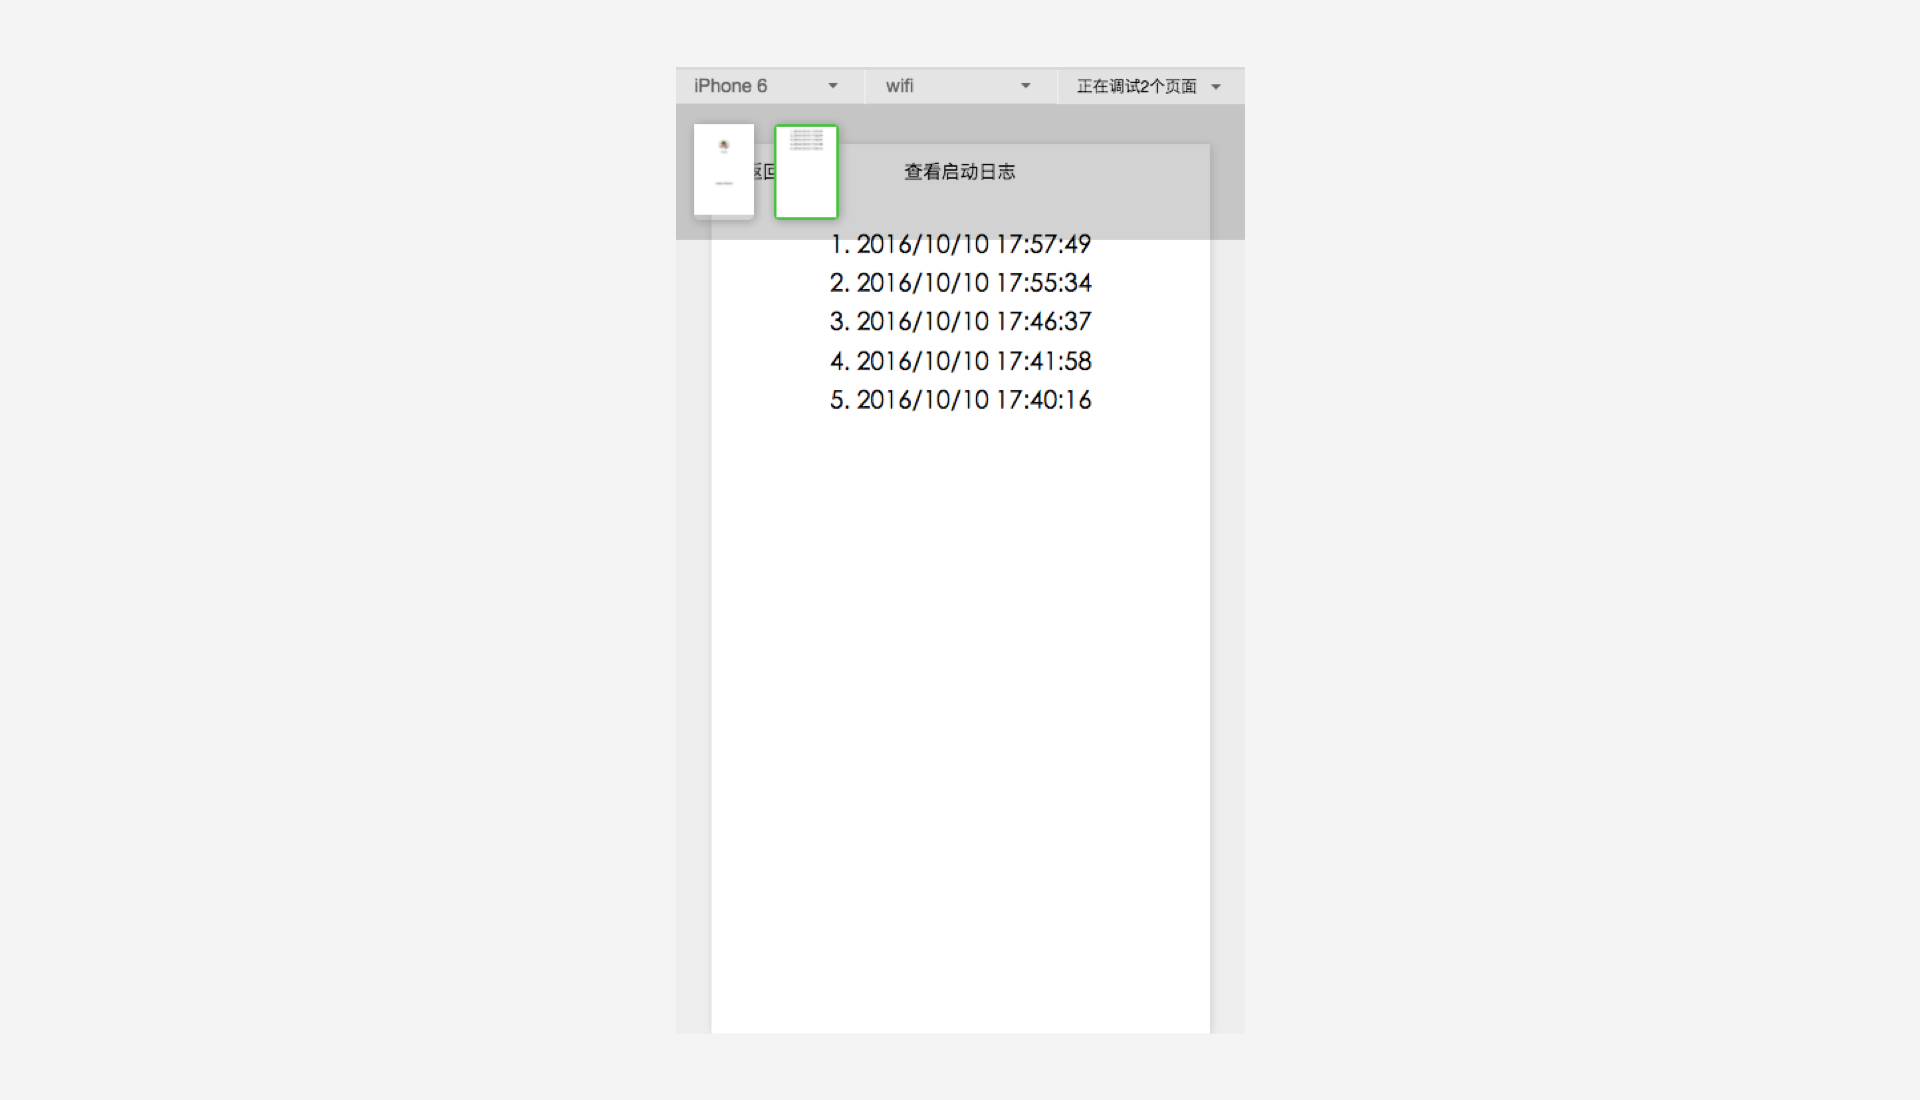
The small program action area helps developers simulate the environment operations of some clients. For example, when a user returns to the chat window from a small program, a small program is triggered to be set as a background api.
When the small program is used to multi-window, you can switch pages in the top operating area, it is important to note that this operation is only for the convenience of developers, in the real WeChat client will not have.
Custom data escalation
The developer tool can edit and debug the data escalation function of the custom analysis, click on the "Tools - Custom Analysis" in the menu bar to pop the window to open the custom analysis:
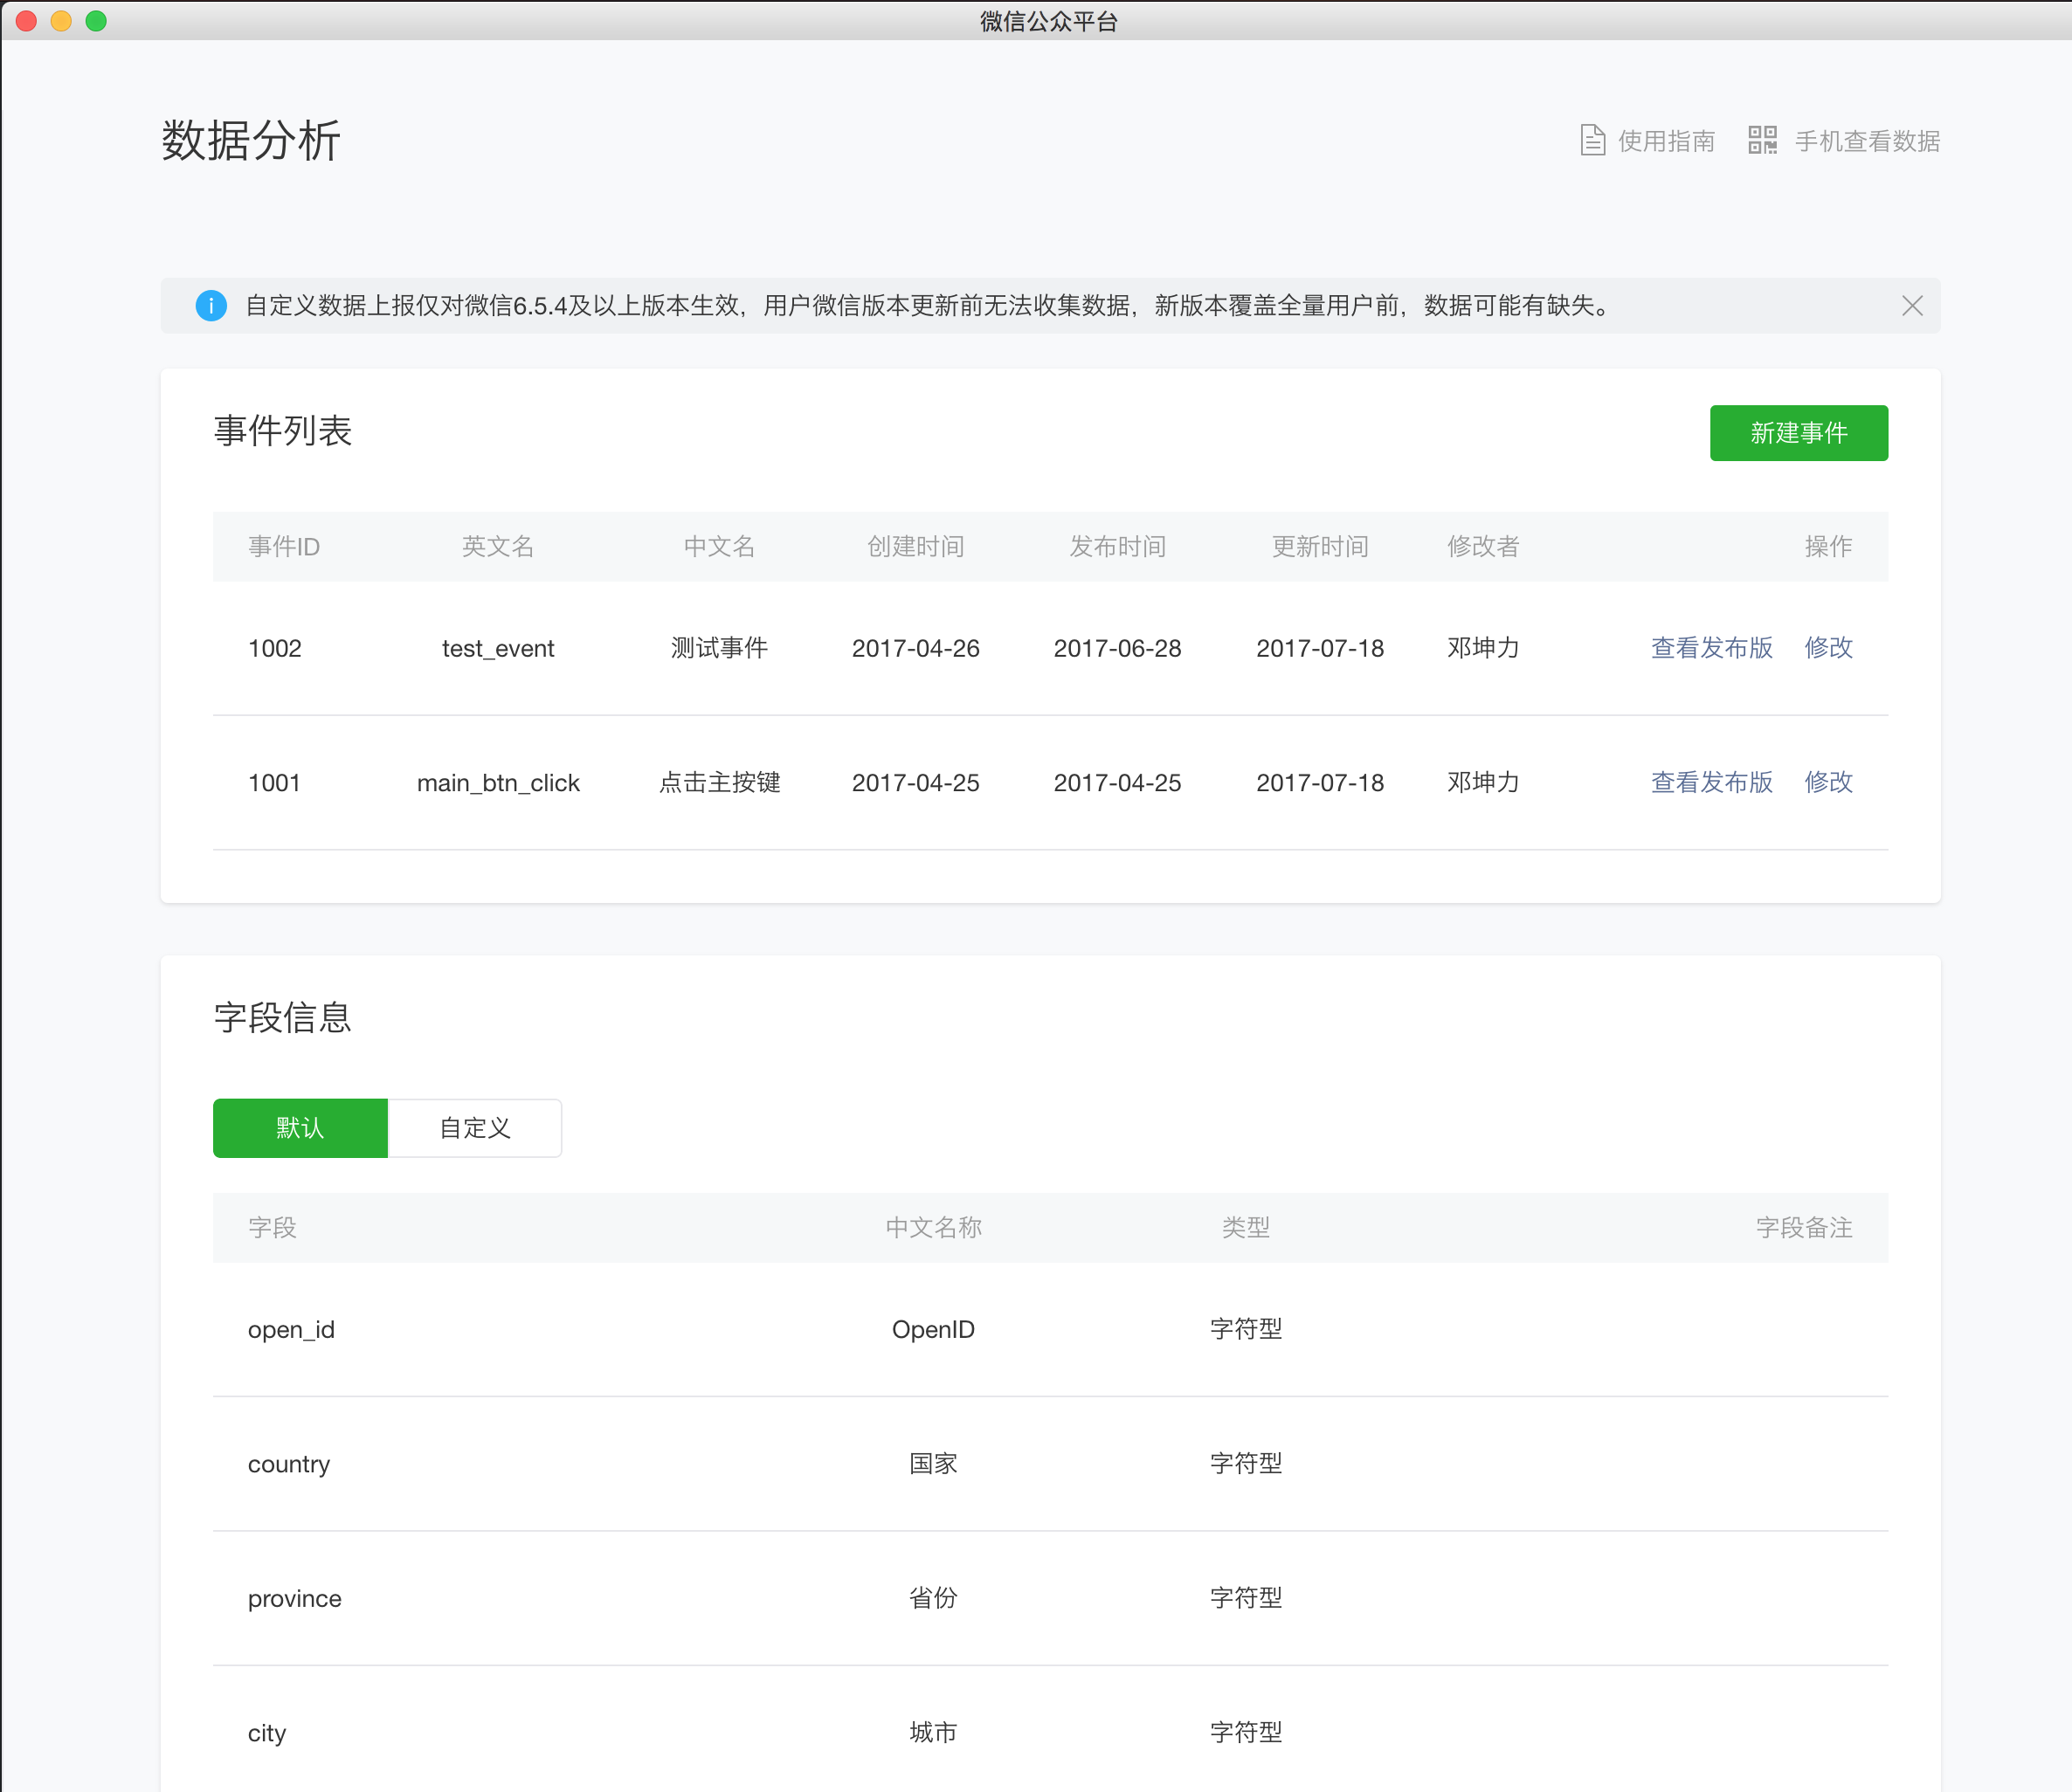
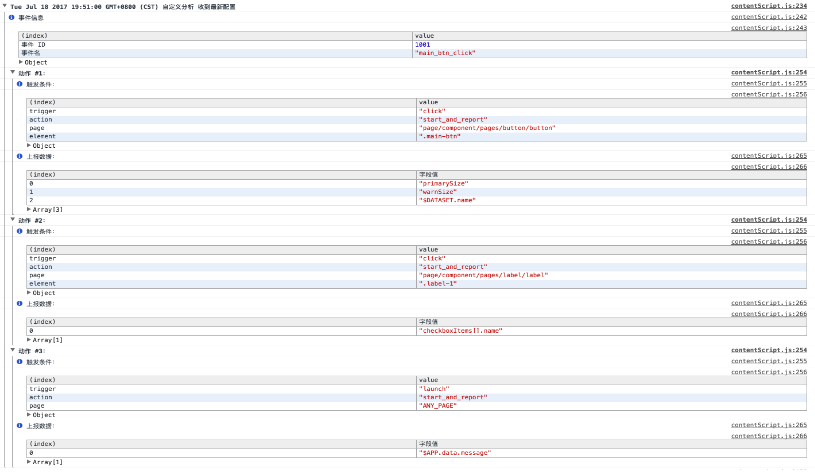
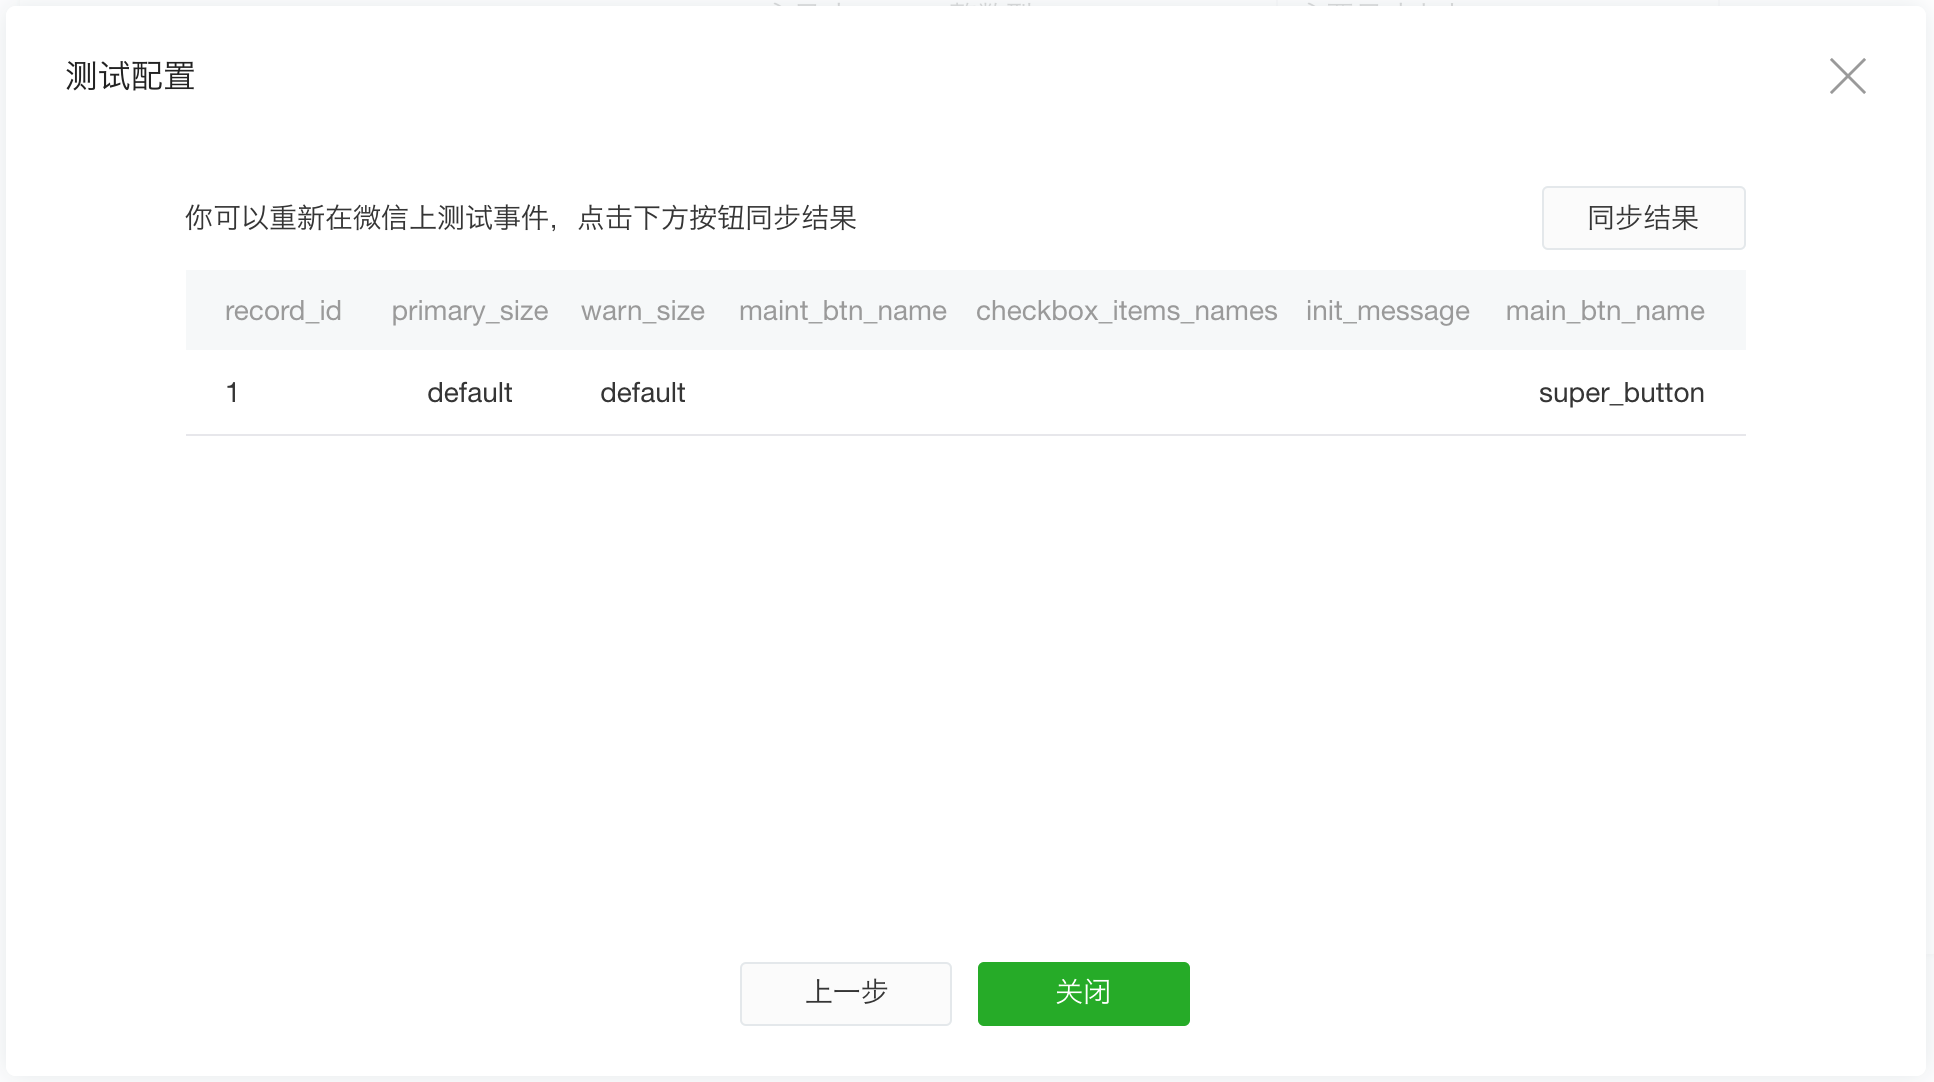
Events can be created, viewed, or modified on the page, and after editing on the page where the event was modified, clicking the Save and Test button at the bottom saves the current configuration, while the tool prompts you on the debugger to receive the latest configuration and displays configuration information, including the ID and name of the event, as well as the trigger conditions and escalation data for each action:
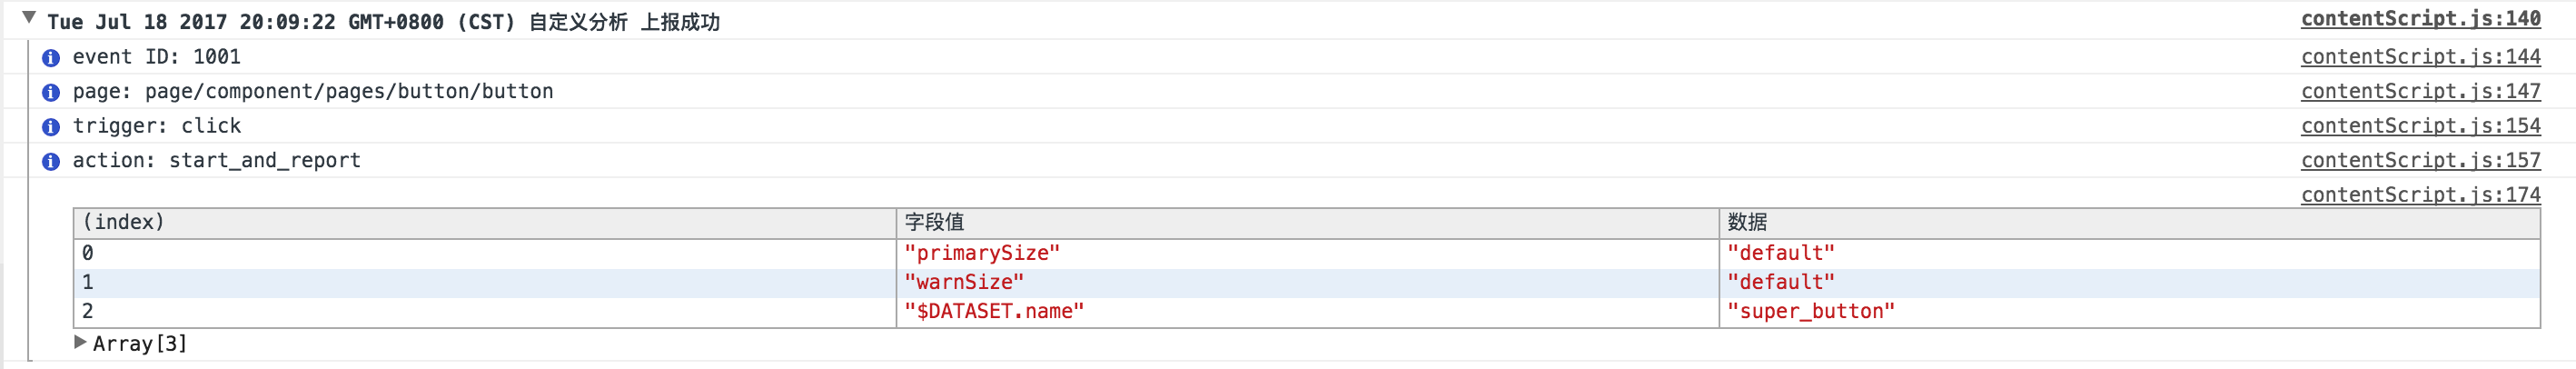
You can then manipulate and trigger events in the emulator. R efreshing the widget in the emulator will also get the test configuration unless the window is closed. T he emulator no longer receives the configuration when the window is closed. When an incident is triggered to escalate, the escalation information is displayed on the tool, including the event ID, trigger page, trigger method, trigger action, and escalated field values and data:
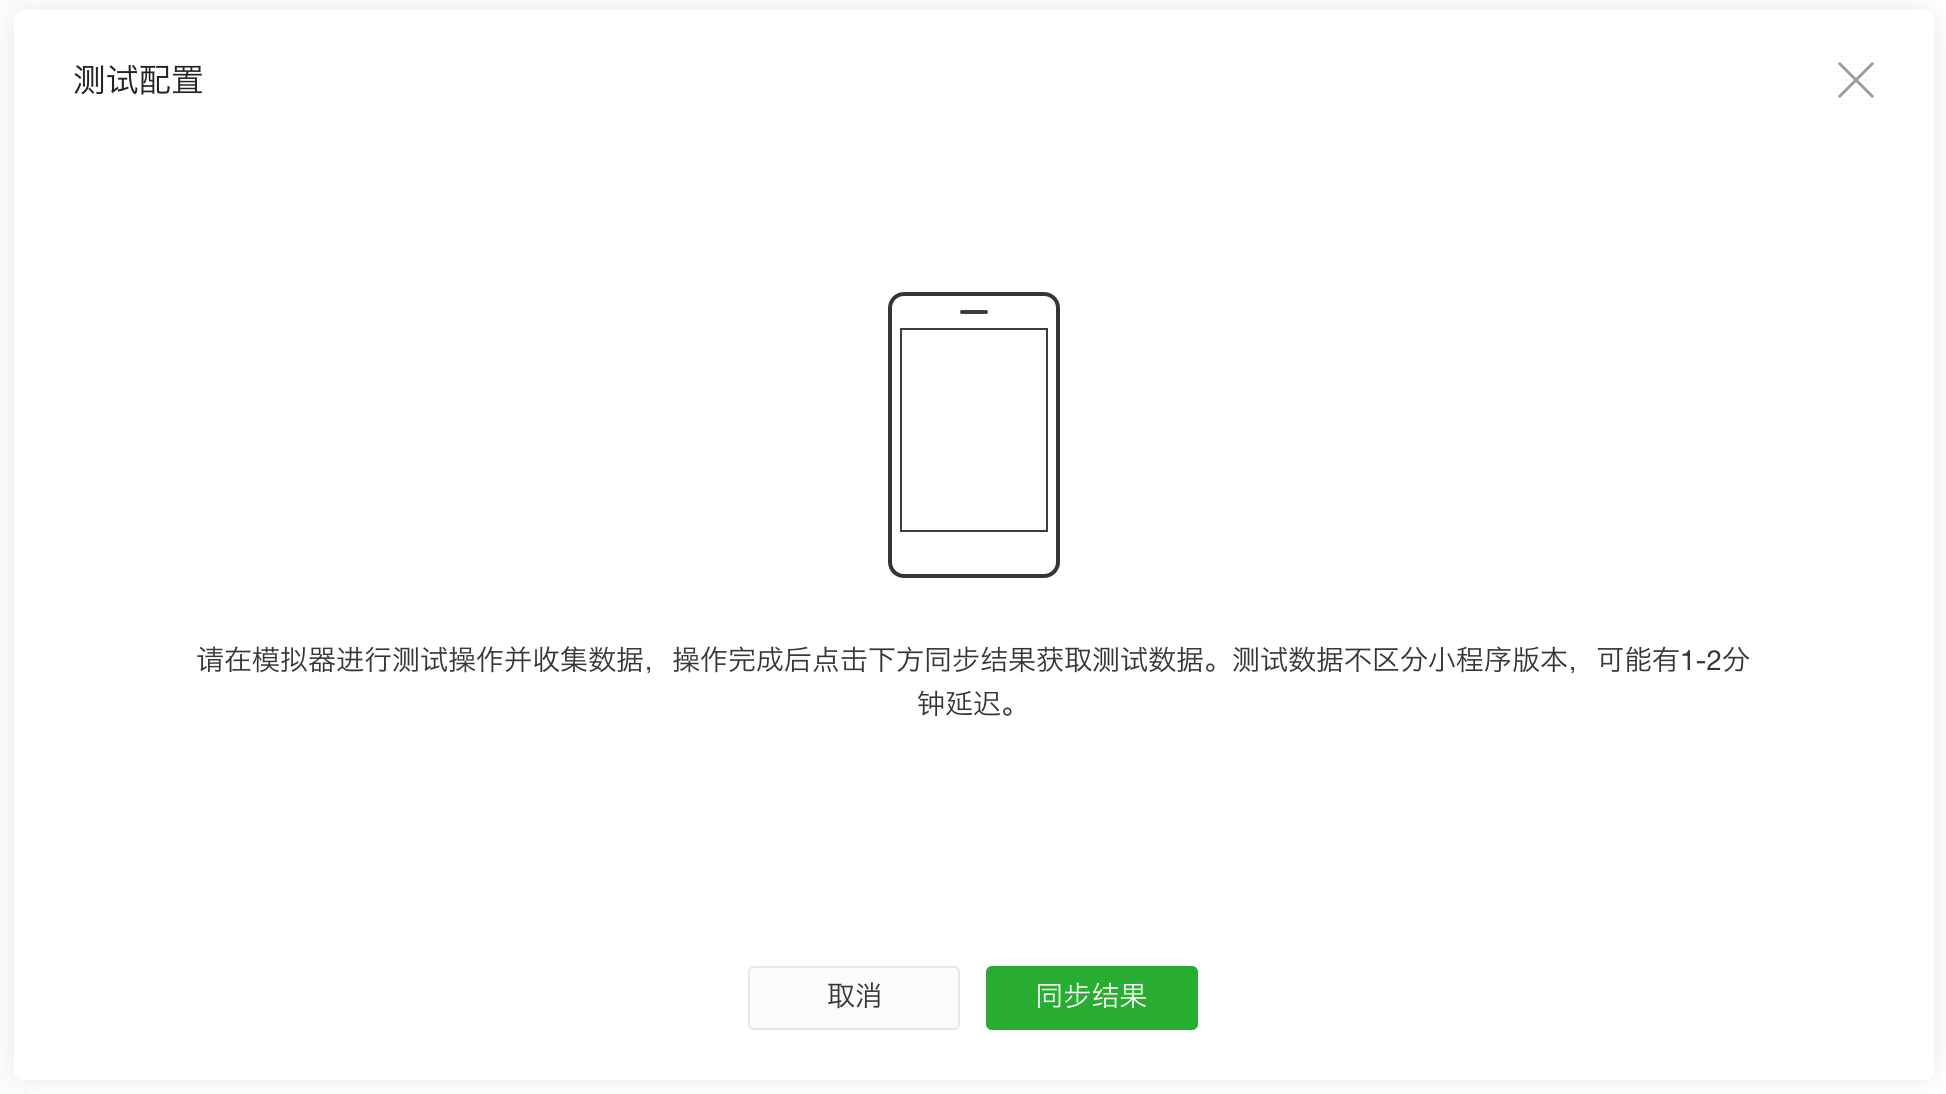
You can also click "Sync Results" in the window to display the reported data in sync:
When the window is closed, the configuration is completely invalidated, and the emulator no longer receives the configuration and no longer triggers escalation (data escalation in the small program using the wx.reportAnalytics API is still output in the tool). Once the test is successful, the event configuration can be published in the background of the small program to formally collect the defined event data.
Auto-preview
Auto Preview enables a quick preview when writing a small program, without the hassle of scanning the code or using a small program development assistant every time you view the effect of a small program. Just press the shortcut to keep WeChat running in the fore desk to automatically call out or refresh the small program.
To use the auto-preview feature, you need to match the WeChat client version of 6.6.7 and above.
To get started with Auto Preview, you can switch to Auto Preview mode by clicking the Auto Preview tab when you open the Preview QR code. O nce you switch to auto-preview mode, you can trigger an auto-preview by simply pressing the preview shortcut or clicking the "Compile and preview" button on the floating window. At this point, the tool uploads code, and the WeChat client that keeps the foretime running automatically refreshes the small program currently under development.
When the auto-preview succeeds, the preview icon on the toolbar appears as a green check. If there is an error in the preview, it will appear as a red exclamation point, which you can click to see the details.
Note that the auto-preview feature is only available on WeChat, the same account that logs on to the developer tool. To return to normal preview mode, simply click on the "Scan QR Code Preview" tab.
Users can customize preview shortcuts in their shortcut settings.
Special scene debugging
Small program developer tools are simulations of WeChat clients, limited by the differences between desktop and mobile devices, and some of WeChat's endethy data, while taking into account the ease of development, some APIs differ in tools and WeChat.
The broom interface
Different from calling the camera directly on the phone to sweep the code, calling the camera on the PC or Mac to sweep the code to complete debugging is an inefficient behavior, so after calling the QR code broom API on the development tool, the developer can choose a local picture for subsequent logical debugging, instead of instead of ingout the camera to sweep the code, the process is different, but the input and output of the interface is consistent.
WeChat payment
The latest version of the developer tool already supports weChat payment debugging, but for security reasons, it's different from calling WeChat payment directly on your phone:
- Newly bound developers need 24 hours before they have permission to debug WeChat payments
- After the developer calls the WeChat Payment API on the tool, a QR code appears on the development tool, and the developer must scan the code using the microscope currently being developed to complete the payment process on the phone
- The tool syncs the return package paid by mobile WeChat into the tool, and the developer does the follow-up on his own
The interaction used is different, but the input and output tools of the interface are consistent with the client.
Start using custom parameters
In daily use, the user can open a small program by scanning the code and sharing, which will jump to the corresponding small program page (not necessarily the home page) and can carry the parameter: query. In developer tools, developers can also debug different startup pages and startup parameters by customizing compilation conditions.
For example, the following image is to choose to go to the page is page/API/index, the parameter is name-can
Enter the scene value
In WeChat clients, users may open small programs in various scenarios, but there is no real environment in the developer tool to simulate these scenarios. Developers can debug different scenarios by conditional compilation.
Normal forwarding
Calling forwarding on developer tools is a simulated behavior and is not actually forwarded to the user, and development can use this simulated behavior to determine whether the forwarding API is called correctly.
Forwarding with shareTicket
Forwarding with shareTicket can get more forwarding information, such as the name of the group chat and the group's identity openGId. On small program developer tools, developers can debug forwarding with shareTicket in the following ways.
When the parameter withShareTicket of wx.showShareMenu is true, a list of test groups appears when you click the forward button that appears after the menu in the upper right corner of the emulator, as shown in the figure:
Developers click to pick any one group, you can get shareTicket through the back package of the interface, and you can get the relevant forwarding information by calling wx.getShareInfo
When a developer needs to debug a scene that starts from a group point and has shareTicket, they can use the 1044: ShareTicket in a custom compilation: a small program message card in a group chat session while selecting any simulated test group, as shown in the figure
Previews use custom compilation conditions
In the same way that startup uses custom parameters, when submitting a preview, developers can do so by debugging different startup pages and startup parameters on mobile devices. We can select custom compilation conditions that have been created for preview.
Jump small program debugging support
Small program jump development debugging can be divided into two parts
Whether the debugging program can jump correctly
For the security of the applet code, when wx.navigateToMiniProgram is called on the tool, the developer tool does not usually open and jump to another applet, but the tool determines the binding relationship between the current applet and the small program that needs to be jumped, and outputs relevant information to the developer. Developers can determine whether a call is successful based on a successful or failed callback function.
Receive parameters correctly when debugging an open program
Select Custom Compilation Enter Scene Select 1037 From Small Program Into Can debug a small program when it is opened to receive the correct parameters and do the relevant processing.
Select Custom Compilation Enter Scenario Select 1038 Return from Small Program Can debug the small program to return when it receives the correct parameters and does the relevant processing.
Real machine debugging
Real remote debugging function can realize the direct use of developer tools, through the network connection, the small program running on the other machine to debug, to help developers better locate and find problems on the phone.
Debug the process
To initiate a real remote debugging process, you first need to click the "Remote Debugging" button on the toolbar of the developer tool.
At this point, the tool will process the local code packaging and upload, ready, using the mobile phone client to scan the QR code can pop up the debug window, start remote debugging.
Remote debug window
Use your phone to scan this QR code to start remote debugging.
To end debugging, close the debugging window directly, or click the "End debugging" button in the lower right corner.
The remote debug window is divided into two parts, the debugger view on the left and the information view on the right. Developers can debug code directly in the debugger and view storage, while the information view can see current connections to phones and servers, error messages, and more.
The debugger
In a debugger for remote debugging, developers can debug code in the Console panel, view the source code for small programs in the Sources panel and do break-point step-by-step debugging, view storage usage of small programs in the Storage panel, and more.
Note that to debug a small program in console, you need to switch the context of debugging to VM Context 1, as shown.
When you view the source code in the Sources panel, all the developer's file paths weapp:// the file.
In addition to being able to do step-by-step debugging in the debugger, developers can manually insert debugger into the code; T he statement performs break point debugging. T herefore, if you want to break points as early as possible when a small program starts, you can manually insert debugger into the code at the required break point before entering remote debugging; statement to implement.
The operation of the WXML, AppData, Storage panel and developer tools debug the simulator is consistent. Note that if Storage on the tool side is uncheicked in the information view on the right, all Storage data will be stored on your phone and the Storage panel will no longer appear.
The information view
The information view on the right shows information about your phone and network connection. M obile phone information shows the phone's model, system, name, WeChat version and other information, as well as communication delay. The smaller the communication delay, the smoother the communication with the phone.
In Connection Information, the tool's connection information to the server is shown, including connection status, server state, and so on, which is shown here when connection failures, server blocking affect the debugging process, and fluency. When the connection status is Ended, debugging is terminated.
Warnings and Errors shows recent errors and warning messages. If the network connection is disconnected, the developer will be asked if they need to reconnect here.
Mobile phone display
The phone side display during debugging is shown below.
When your phone has no network or enters a break point state, a floating prompt appears and prevents further action.
The game is debugged remotely
Currently only 1.02.1809260 and above versions of the tool, iOS 11.2 to 11.4.1 system 6.7.2 and above versions of WeChat clients, and Android system 6.7.3 and above versions of WeChat clients.
Unlike small programs, the "Contexts" bar may appear on the right side of the debugging window, allowing you to click on the different JavaScript contexts that you want to debug.
By default, the tool uploads Source Map with full source code for ease of debugging. If you don't want to upload, or if you don't want the code ranks to map err, you can turn this option off in the lower right option and unchep the "Auto-compression confusion when uploading code" option in the item details.
Note: Storage panels are not currently supported.
Multi-account debugging
Developer tools need to log in using microspograms, which we use as the primary account for all open projects, and when the login changes, their login status is synced to all open project windows;
The function entrance
Through the Menu - Tools - Multi-Account Debugging you can use the Multi-Account Debugging feature
How to use it
You can add a test account using a WeChat scan QR code that is different from the primary account number, and if the test account is logged in to another developer tool client, the login status will be invalidated
By clicking on ''','-'
We can check multiple accounts at the same time, open multiple debug windows to debug the same project, debug window and project main window, only the simulator and debugger, the project code editing or need to be carried out in the project main window, code saving, each debug window can be synchronized to execute the latest code