Tableau table calculation
May 26, 2021 Tableau
These are the calculations of values that apply to the entire table. /b10> For example, in order to calculate run totals or run averages, we need to apply a single calculation method to the entire column. /b11> Such calculations cannot be performed on some selected rows.
Tables have a feature called Quick Table Calculations to create such calculations. The steps applied in a quick table calculation are as follows:
Step 1
Select the measure to apply the table calculation and drag it to the shelf.
Step 2
Right-click the measure, and then select the Quick Table Calculation option.
Step-3
Select one of the following options to apply to the measure.
- Summary
- Difference
- Percentage difference
- Percentage of total
- Ranking
- Percent bit
- Moving average
- Year-to-date total
- COMPOUND growth rate
- Year-on-year growth
- Year-to-date growth
Set up visualizations
- Open Tableau Desktop and connect to the Sample-Superstore data source that came with Tableau.
- Navigate to the new worksheet.
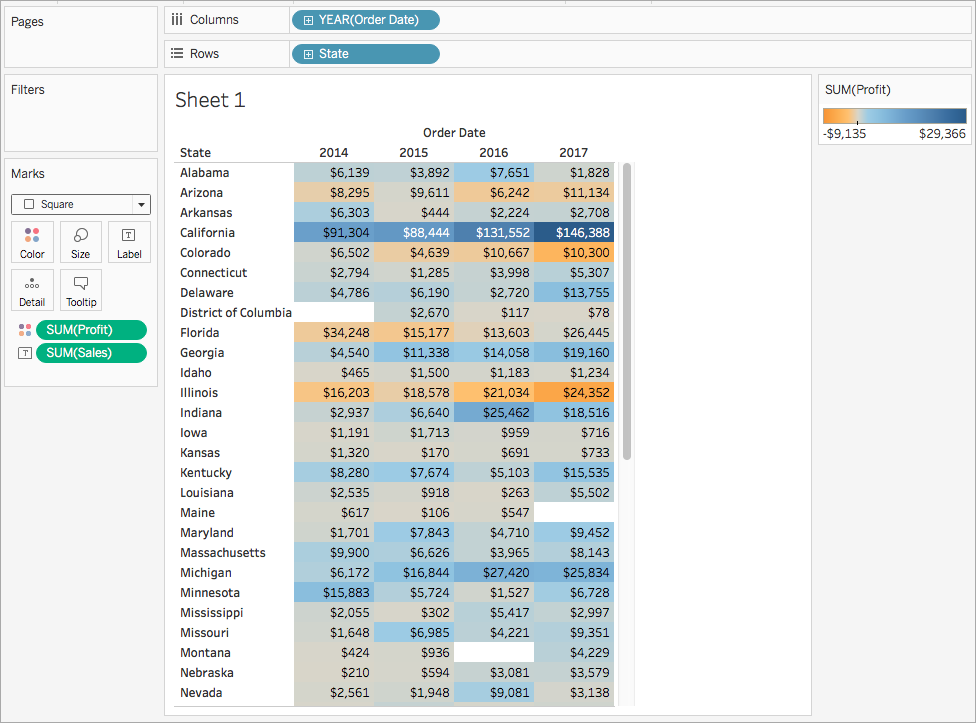
- Under Dimensions in the Data pane, drag Order Date to the Columns area.
- Drag State (state) to the Rows area from Dimensions in the Data pane.
- Under Measures in the Data pane, drag Sales to Text on the Marks card.
- Drag Profit to Color on the Mark card from Measures in the Data pane.
-
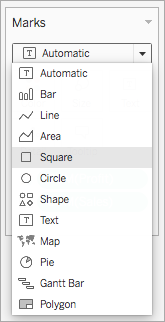
On the Tag card, click the Tag Type downlier list and select Block.
The visualization will be updated as follows:
Apply quick table calculations
-
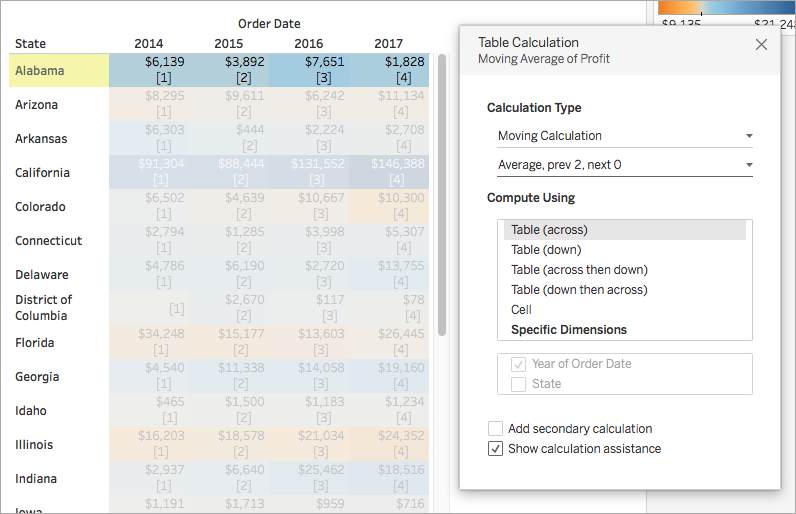
On the Mark card, right-click SUM and select Quick Table Calculations. N
ote: You can only perform quick table calculations on measures in the view. A
triangular symbol appears on the field indicating that a quick table calculation is being applied to the field. T
he colors in the visualization are updated to show the moving average of profits across years.

(Optional) custom quick table calculations
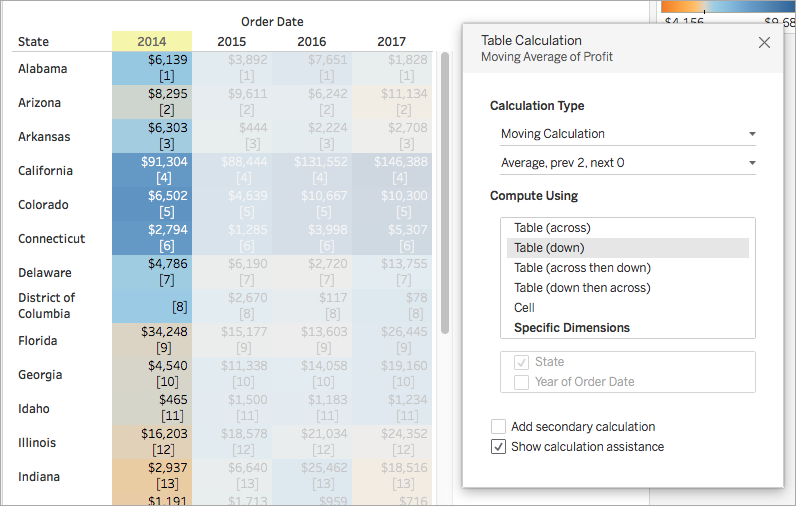
- On the Marks card, right-click Sum and select Edit Table Calculations.
-
In the open dialog box, you can configure the following options:
- How to calculate the aggregation of type values (how to address and partition calculations)
- More information about these options
- The visualization updates as you make changes to the calculation. H ighlights and numbers are used to demonstrate how calculations are performed. For example, in the following figure, calculations are performed across tables for each state.
If you change this setting, the visualization and highlighted content are updated to indicate the change.