Tableau predicts
May 26, 2021 Tableau
Table of contents
Forecasting is about the future value of predictive measures. /b10> There are many mathematical models for prediction. /b11> Tableau uses models that are known to be exponentially smooth. /b12> In exponential smoothing, recent observations give a relatively heavier weight than the old observations. /b13> These models capture trends or seasonality in the evolution of data and extend them to the future. /b14> The predicted results can also be fields created in the visualization.
Tableau uses a one-time dimension and a measure field to create predictions.
Create a prediction
Using the Ample-superstore, let's predict the value of next year's volume sales. To achieve this, we follow these steps.
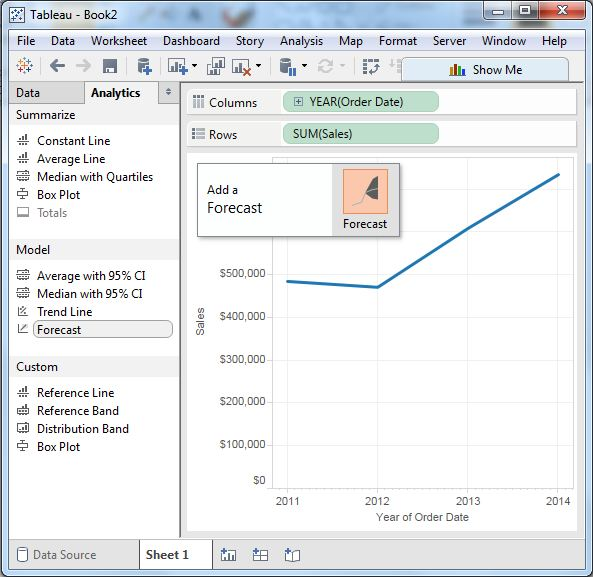
Step 1
Create a line chart that has the order date (year) in the column frame and sales in the row frame. /b10> Go to the Analysis tab shown below, and then click the predictions under the model.
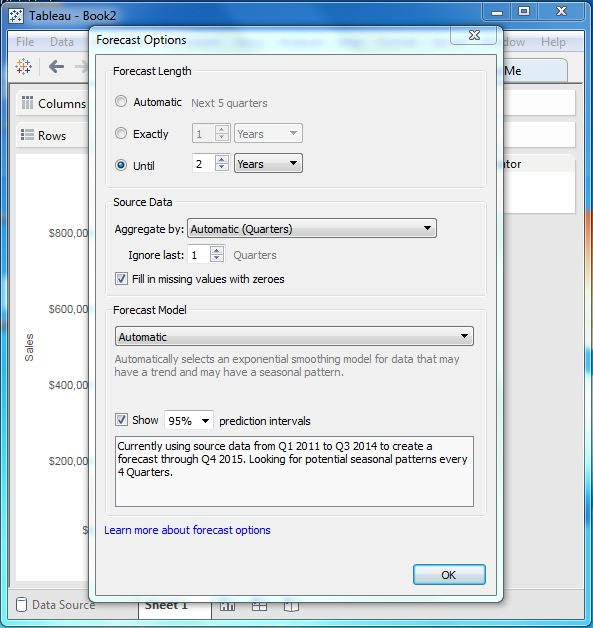
Step 2
After completing the above steps, we can choose to set up various forecasting options. /b10> We select the forecast length to be 2 years and leave the forecast model as automatic, as shown below.
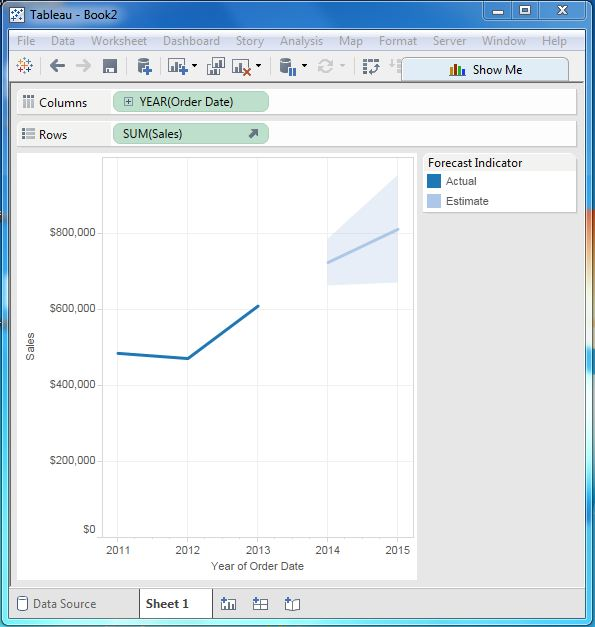
After completing the above steps, we get the final forecast as follows.
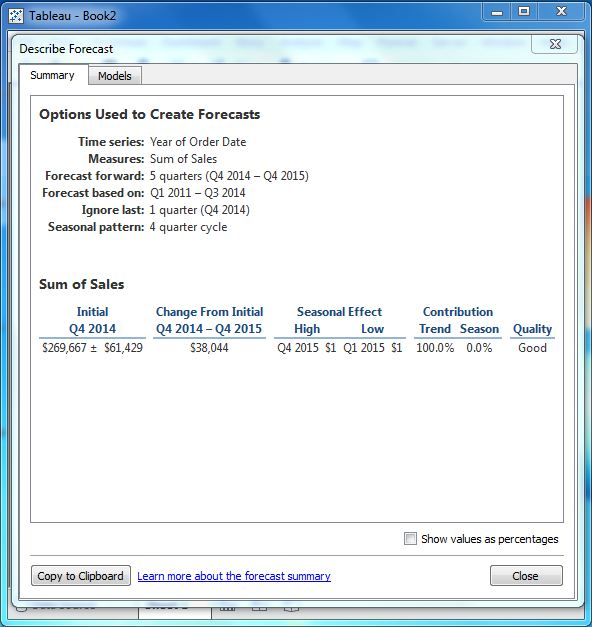
Describe the forecast
We can also get more information about the forecast model by selecting the Description Prediction option. /b10> We get this option by right-clicking on the forecast chart shown above.