Tableau Ganttu
May 26, 2021 Tableau
Table of contents
The Gantt chart shows the progress of the value of a task or resource over time. /b10> It is widely used in project management and other types of changes over time for research. /b11> Therefore, the time dimension is an important area in the Gant diagram.
In addition to the time dimension, the Gantt chart requires at least one dimension and one measure.
Create a Gantt diagram
Using the Ample-superstore, we plan to find changes in the number of different subcategories of products over a period of time based on their ship patterns. /b10> To achieve this, we follow these steps.
Step 1
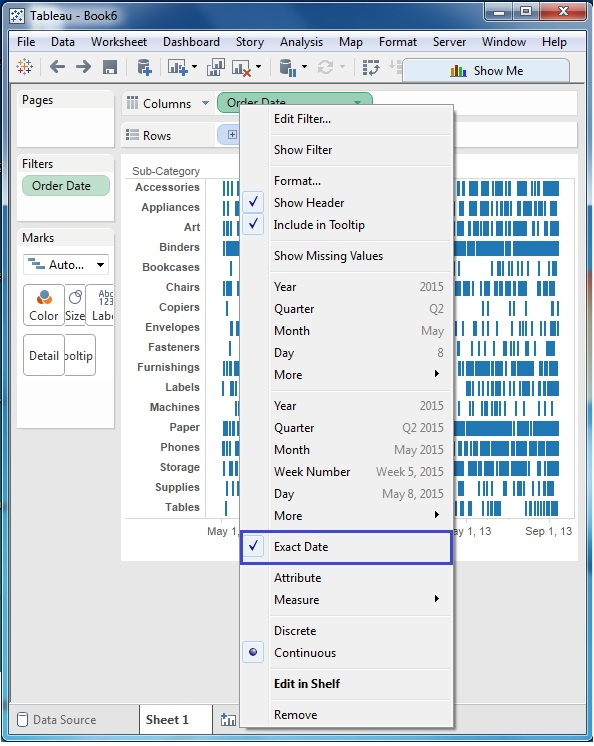
Drag the dimension order date to the column frame and subcategories to the row shelf. /b10> Next, we add the order date to the filter shelf. /b11> Also right-click on the order date to convert it to the exact date value. /b12> It is shown in the figure below.
Step 2
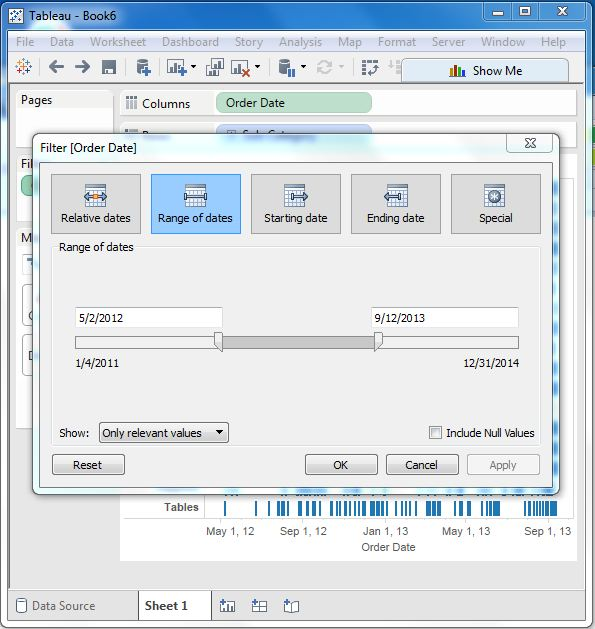
Next, we edit the filter to select the date range. /b10> This is because we need separate date values, and there are very many dates in the data. /b11> The scope of creation is shown below.
Step 3
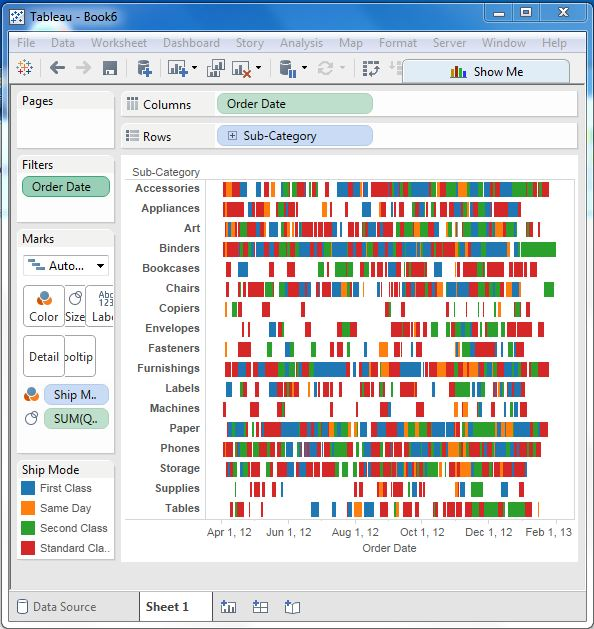
Next, we drag the dimension shipping mode to the color shelf and the measure quantity to the dimension shelf under the marker card. /b10> This produces a Gantt diagram, as shown below.