SAS histogram
May 27, 2021 SAS
Table of contents
A histogram is a graphical display of data that uses bars of different heights. I t divides the various numbers in the data set into many ranges. I t also represents an estimate of the probability of distribution of continuous variables. I n SAS, PROC UNIVARIATE is used to create histograms with the following options.
Grammar
The basic syntax for creating histograms in SAS is:
PROC UNIVARAITE DATA = DATASET;
HISTOGRAM variables;
RUN;
The following is a description of the parameters used:
- DATASET is the name of the dataset used.
- A variable is the value used to draw a histogram.
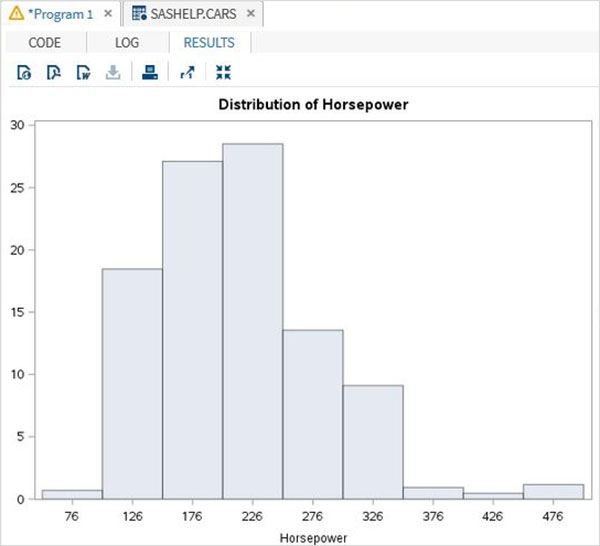
Simple histogram
Create a simple histogram by specifying the name of the variable and the range of values to be considered.
Cases
In the following example, we consider the minimum and maximum values of the variable horsepower, with a range of 50. So these values form a group of 50 steps.
proc univariate data=sashelp.cars;
 histogram horsepower
 / midpoints = 176 to 350 by 50;
run;
When we execute the above code, we get the following output:
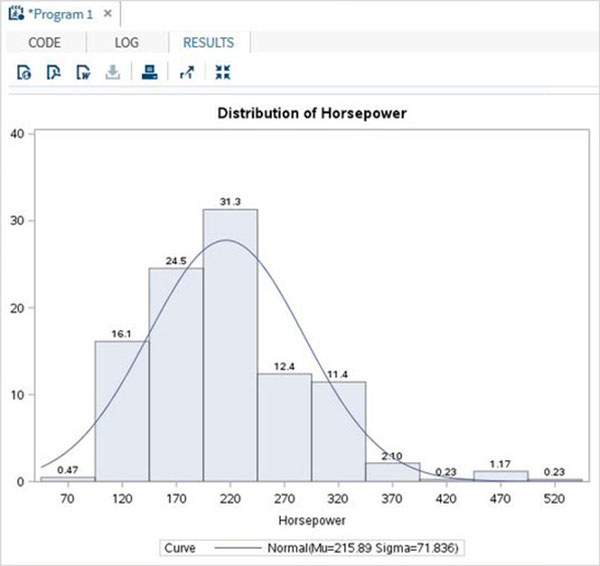
A histogram with a curved fit
We can use additional options to fit some distribution curves into histograms.
Cases
In the following example, we fit a distribution curve whose mean and standard deviation values are called EST. T his option uses and estimates parameters.
proc univariate data=sashelp.cars noprint;
 histogram horsepower
 /
 normal (
 mu = est
 sigma = est
 color = blue
 w = 2.5
 )
barlabel=percent
 midpoints = 70 to 550 by 50;
run;
When we execute the above code, we get the following output: