SAS correlation analysis
May 27, 2021 SAS
Table of contents
Correlation analysis deals with the relationships between variables. C orrelation coefficients are measures of a linear association between two variables. T he value of the correlation coefficient is always between -1 and .1. S AS provides the process PROC CORR to find correlation coefficients between a pair of variables in the dataset.
Grammar
The basic syntax for applying PROC CORR in SAS is:
PROC CORR DATA = dataset options;
VAR variable;
The following is a description of the parameters used:
- Dataset is the name of the dataset.
- Options are additional options that include procedures such as drawing matrices.
- A variable is the name of a variable for a dataset that finds relevance.
Cases
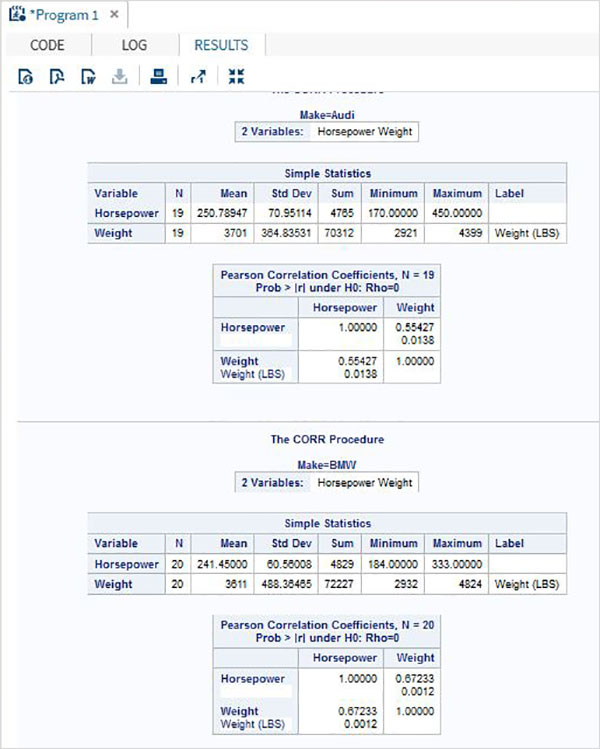
Correlation coefficients between a pair of variables available in the data set can be obtained by using their names in VAR statements. I n the following example, we use the dataset CARS1 and get the results that show the correlation coefficient between horsepower and weight.
PROC SQL;
create table CARS1 as
SELECT invoice,horsepower,length,weight
 FROM
SASHELP.CARS
WHERE make in ('Audi','BMW')
;
RUN;

proc corr data=cars1 ;
VAR horsepower weight ;
BY make;
run;
When we execute the code above, we get the following results:
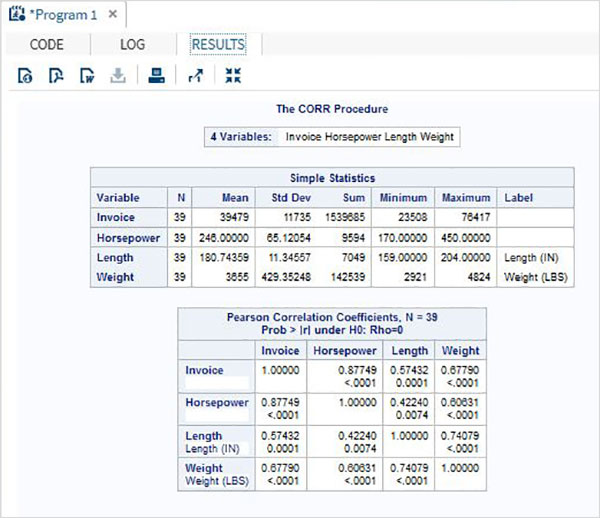
Correlation between all variables
By simply applying the procedure with the dataset name, you can get correlation coefficients between all the variables available in the dataset.
Cases
In the following example, we use the dataset CARS1 and get the results that show the correlation coefficients between each pair of variables.
proc corr data=cars1 ;
run;
When we execute the code above, we get the following results:
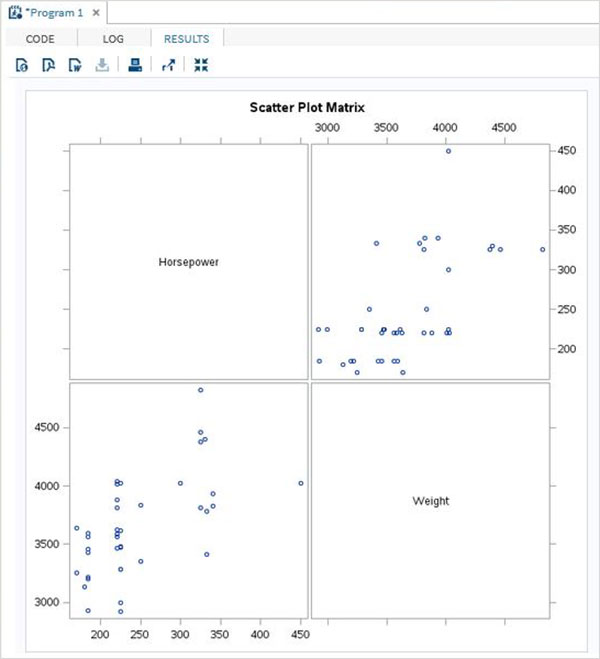
Correlation matrix
We can get a scatterpic matrix between variables by selecting the option to draw the matrix in the PROC statement.
Cases
In the following example, we get a matrix between horsepower and weight.
proc corr data=cars1 plots=matrix ;
VAR horsepower weight ;
run;
When we execute the code above, we get the following results: