R language line chart
May 12, 2021 R language tutorial
Table of contents
A line chart is a diagram that connects a series of points by drawing segments between them. T hese points are sorted in one of their coordinate (usually x coordinate) values. Line charts are typically used to identify trends in data.
The
plot() function in the R language
is used to create a line chart.
Grammar
The basic syntax for creating a line chart in the R language is -
plot(v,type,col,xlab,ylab)
The following is a description of the parameters used -
-
v is a vector that contains values.
-
The type draws only points with the value "p", "l" draws only lines and "o" draws points and lines.
-
xlab is the label for the x-axis.
-
ylab is the label for the y-axis.
-
Main is the title of the chart.
-
Col is used to give points and lines the color.
Cases
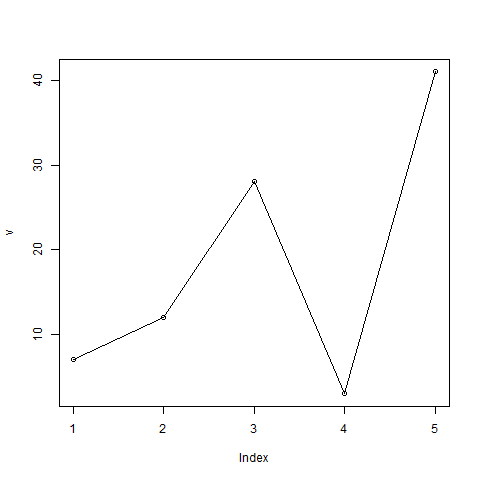
Create a simple line chart using the input vector and type parameter "O". T he following script creates and saves a line chart in the current R working directory.
# Create the data for the chart.
v <- c(7,12,28,3,41)

# Give the chart file a name.
png(file = "line_chart.jpg")

# Plot the bar chart.
plot(v,type = "o")

# Save the file.
dev.off()
When we execute the code above, it produces the following results -
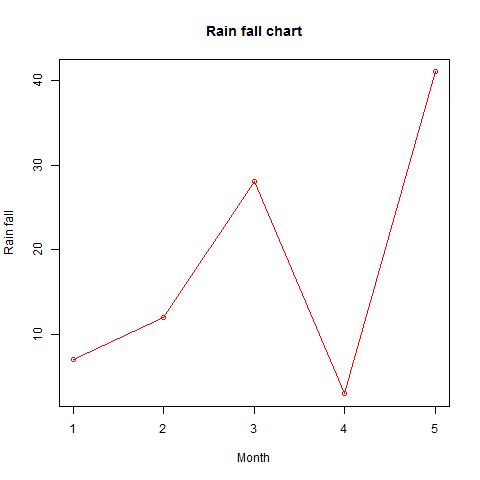
Line chart titles, colors, and labels
The characteristics of a line chart can be extended by using additional parameters. W e add colors to points and lines, titles to charts, and labels axes.
Cases
# Create the data for the chart.
v <- c(7,12,28,3,41)

# Give the chart file a name.
png(file = "line_chart_label_colored.jpg")

# Plot the bar chart.
plot(v,type = "o", col = "red", xlab = "Month", ylab = "Rain fall",
   main = "Rain fall chart")

# Save the file.
dev.off()
When we execute the code above, it produces the following results -
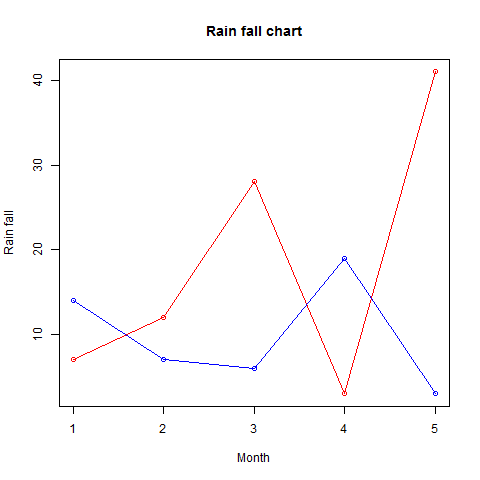
Multi-line line chart
By using the line() function, you can draw multiple lines on the same chart.
After drawing the first line, the
()
function can use an additional vector as input to draw the second row in the chart.
# Create the data for the chart.
v <- c(7,12,28,3,41)
t <- c(14,7,6,19,3)

# Give the chart file a name.
png(file = "line_chart_2_lines.jpg")

# Plot the bar chart.
plot(v,type = "o",col = "red", xlab = "Month", ylab = "Rain fall",
   main = "Rain fall chart")

lines(t, type = "o", col = "blue")

# Save the file.
dev.off()
When we execute the code above, it produces the following results -