R language decision tree
May 12, 2021 R language tutorial
Table of contents
A decision tree is a graph that represents the selection and its results in the form of a tree. T he nodes in the figure represent events or selections, and the edges of the graph represent decision rules or conditions. It is primarily used in machine learning and data mining applications using R.
Examples of the use of decision trees are - predicting that e-mail is spam or non-spam, predicting cancerous tumors, or predicting the credit risk of loans based on these factors. T ypically, you use observational data, also known as training data, to create models. T hen use a set of validation data to validate and improve the model. R has packages for creating and visualizing decision trees. For the new set of predictors, we use this model to determine that the R-pack "party" is used to create the decision tree.
Install the R language pack
Use the following commands in the R language console to install the package. Y ou must also install the relevant package, if any.
install.packages("party")
The "party" package has a function
ctree()
for creating and analyzing the decision tree.
Grammar
The basic syntax for creating a decision tree in R is -
ctree(formula, data)
The following is a description of the parameters used -
-
Formula is a formula that describes predictors and response variables.
-
Data is the name of the dataset used.
Enter the data
We'll create a decision tree using an R-built-in dataset called ReadingSkills. I t describes someone's reading Skills score if we know the variables "age," "shoesize," "scores," and whether that person is a native speaker.
Here is the sample data.
# Load the party package. It will automatically load other dependent packages.
library(party)

# Print some records from data set readingSkills.
print(head(readingSkills))
When we execute the code above, it produces the following results and charts -
  nativeSpeaker   age   shoeSize      score
1           yes     5   24.83189   32.29385
2           yes     6   25.95238   36.63105
3            no    11   30.42170   49.60593
4           yes     7   28.66450   40.28456
5           yes    11   31.88207   55.46085
6           yes    10   30.07843   52.83124
Loading required package: methods
Loading required package: grid
...............................
...............................
Cases
We'll use the ctree() function to create a decision tree and view its graphics.
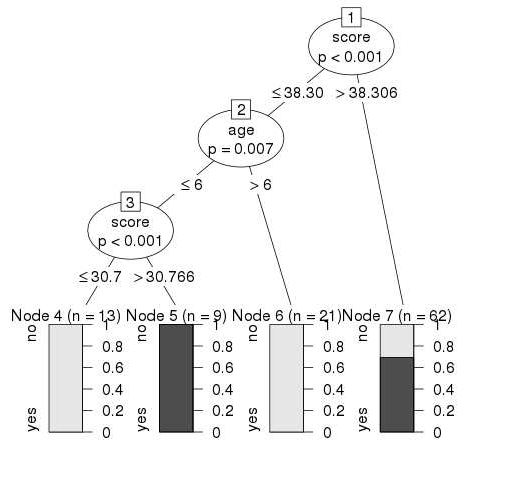
# Load the party package. It will automatically load other dependent packages.
library(party)

# Create the input data frame.
input.dat <- readingSkills[c(1:105),]

# Give the chart file a name.
png(file = "decision_tree.png")

# Create the tree.
  output.tree <- ctree(
  nativeSpeaker ~ age + shoeSize + score,
  data = input.dat)

# Plot the tree.
plot(output.tree)

# Save the file.
dev.off()
When we execute the code above, it produces the following results -
null device
          1
Loading required package: methods
Loading required package: grid
Loading required package: mvtnorm
Loading required package: modeltools
Loading required package: stats4
Loading required package: strucchange
Loading required package: zoo

Attaching package: ‘zoo’

The following objects are masked from ‘package:base’:

    as.Date, as.Date.numeric

Loading required package: sandwich
Conclusion
From the decision tree shown above, we can conclude that people with readingSkills scores below 38.3 and over 6 years of age are not native speakers.