MS Access reporting foundation
May 17, 2021 MS Access
Table of contents
In this chapter, we'll cover the basics of reporting and how to create it. ts. or example, you can create a simple phone number report for all contacts.
-
A report includes information extracted from a table or query, as well as information stored with the report design, such as labels, titles, and graphics.
-
A table or query that provides the underlying data is also known as a record source for a report.
-
If all the fields you want to include exist in a single table, use that table as the record source.
-
If the field is contained in more than one table, you need to use one or more queries as the record source.
Example
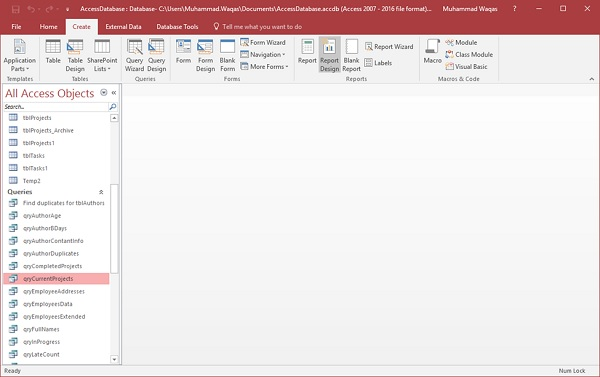
Now, let's take a simple example of the process of creating a very simple report. To do this, we need to go to the Create tab.
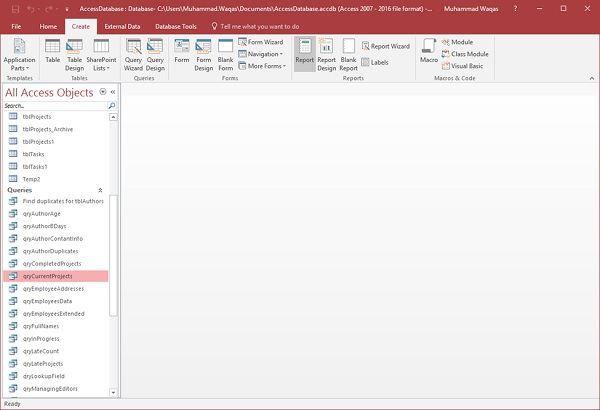
Before you click the report button to create a basic report, make sure that the correct query is selected. ry. ow click the report button, which will generate a report based on the query.
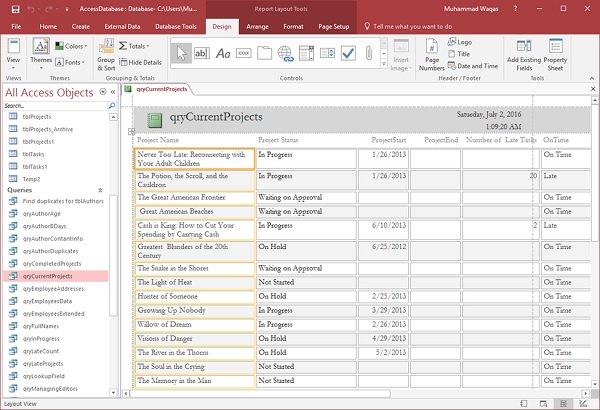
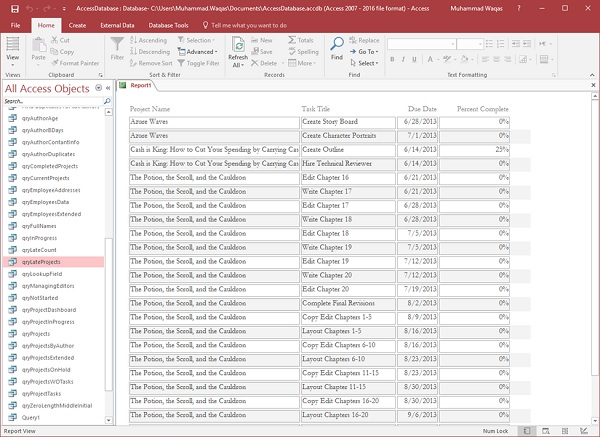
You'll see the report open in layout view. T his quickly adjusts the size or width of any field you see on the report. Let's adjust the column width now to make everything better.
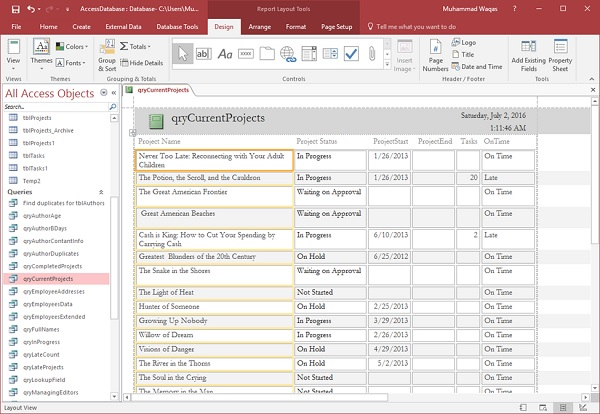
Scroll down and adjust the page controls at the bottom.
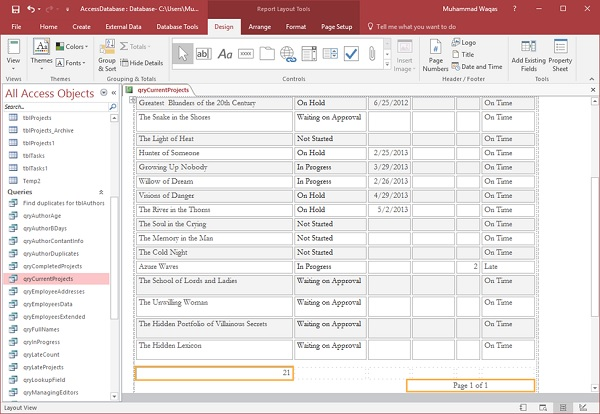
This is a very quick way to create a very simple report. You can also make small changes and adjustments from the report design view.
- Like forms, reports are made up of different parts.
- You have the details section, which is where most of all the data exists.
- You will also see a header and footer section; They appear at the top and bottom of each page in the report.
Now let's change the title of the report and give you another name.

Click the save icon to save the report.
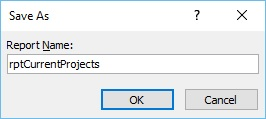
You will get the dialog box above.
Enter the name of the report, and then click OK. I f you want to see the actual appearance of this report, in the print preview, you can go back to the View button and then click Print Preview to see what the report will look like when printed as paper or PDF.
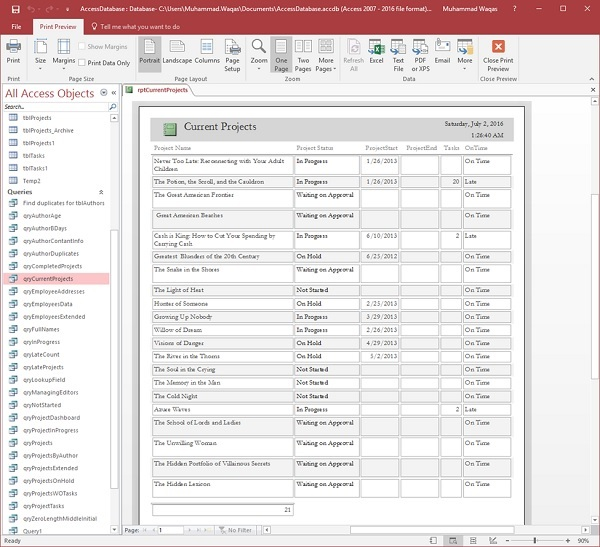
With the tool in the lower right corner, you can zoom in or out. b20> b30> r if you have a longer report, you can view four pages, eight pages, or twelve pages at a time. b40> ab.
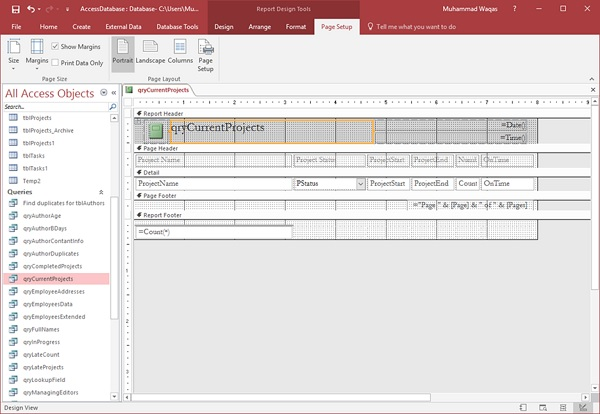
Create a report using a report design
Report design is another way to create quick reports in Access. T o do this, we need to use the Report Design View button, which is similar to the Design button. rt.
Let's go to the Create tab now and click the Report Design button.
It opens a blank report or an unbound report, which means that the report is not connected to other objects in our database.
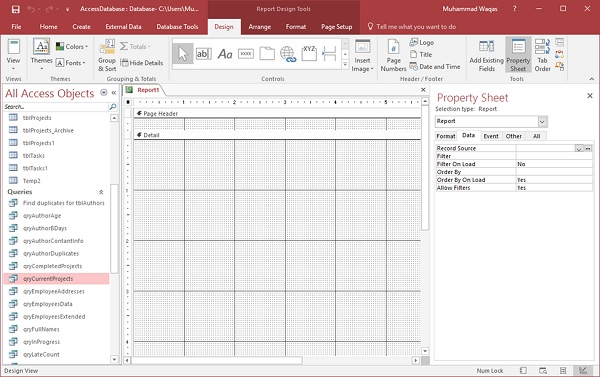
On the Design tab in the Tools group, select the property sheet. This opens the Properties pane.

On the Data tab, assign a record source to this report to connect it to a database object, as shown in the following screenshot.
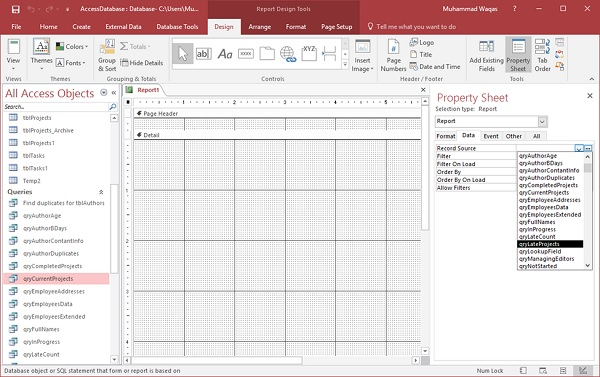
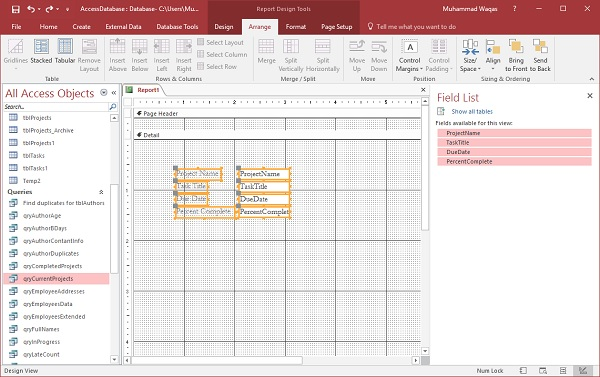
Select qryLateProjects from the drop-down list, and now the next step is to click the Add Existing Fields list button on the Design tab to add some fields to the report.
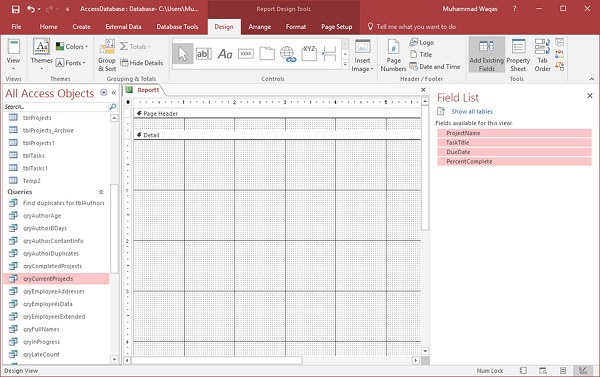
Select the field in the screenshot above.
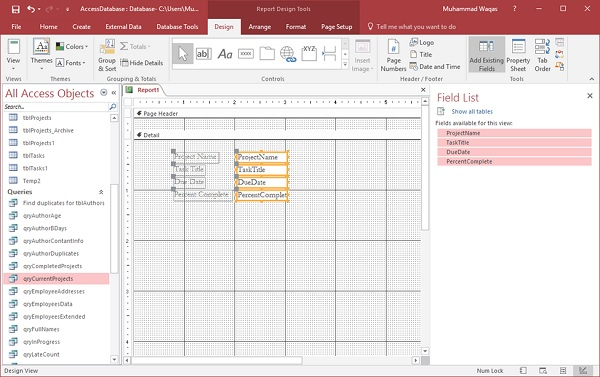
Drag the field to the report, as shown in the screenshot above. Go to the Arrange tab, where you have several options to choose from in a table group.
There is a stacked layout and a table layout, which is very similar to a spreadsheet layout. Let's choose the table layout.
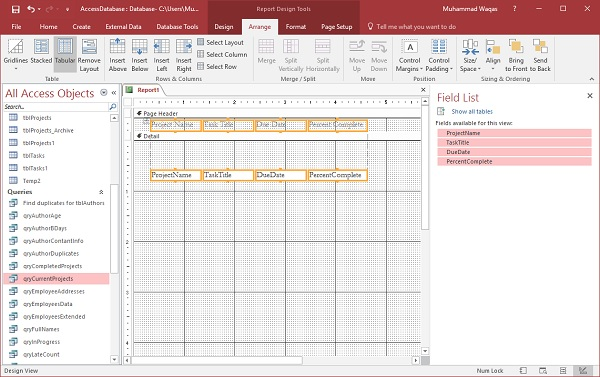
You can see that it moves all the labels to the header area. b20> er.
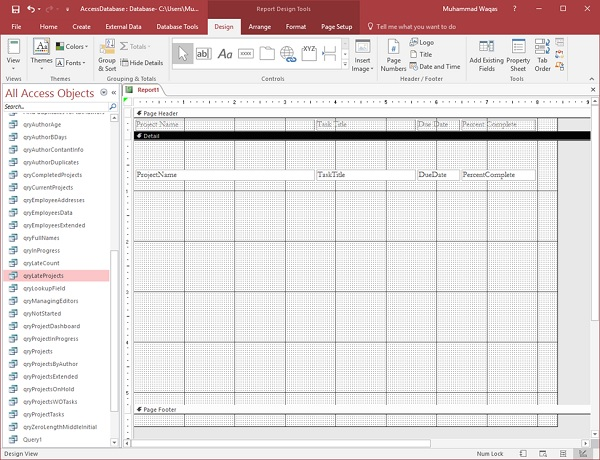
As you can see in the screenshot above, there is a lot of space between the Detail section and Page Footer.
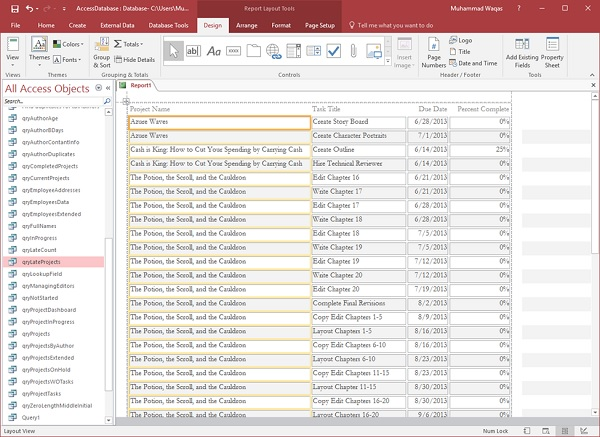
Let's drag the footer up to reduce space, as shown in the screenshot below. We'll now go to the Design tab, then click the View button and select Report View.
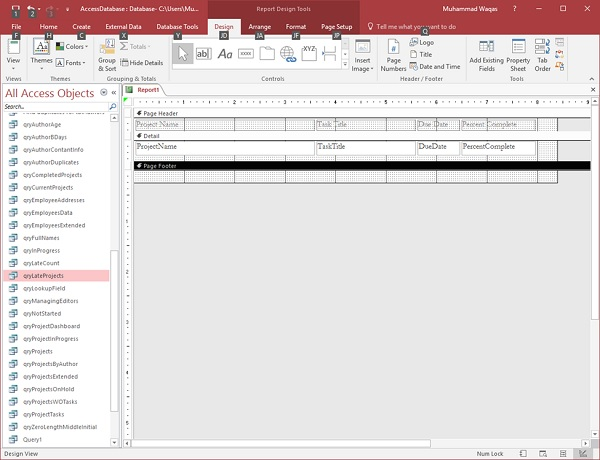
You can now see that some project names are incomplete; You can use the design view to adjust this setting, or you can use the layout view to do so.
This is how to create a simple report from a design view.