jQuery EasyUI Data Grid - Conditions set the row background color
May 09, 2021 jQuery EasyUI
Table of contents
jQuery EasyUI Data Grid - Condition setting row background color
The examples in this section make changes to the style of rows in the jQuery EasyUI datagrid, depending on the settings. When the value of listprice is set to greater than 50, we set a different color for the row.
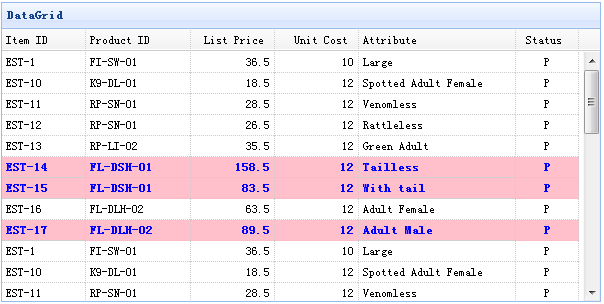
The rowStyler function of the data grid is designed to allow you to customize row styles. The following code shows how to change the line style:
	<table id="tt" title="DataGrid" style="width:600px;height:250px" 			url="data/datagrid_data.json" 			singleSelect="true" fitColumns="true">
		<thead>
			<tr>
				<th field="itemid" width="80">Item ID</th>
				<th field="productid" width="80">Product ID</th>
				<th field="listprice" width="80" align="right">List Price</th>
				<th field="unitcost" width="80" align="right">Unit Cost</th>
				<th field="attr1" width="150">Attribute</th>
				<th field="status" width="60" align="center">Stauts</th>
			</tr>
		</thead>
</table> $('#tt').datagrid({
rowStyler:function(index,row){
if (row.listprice>50){
return 'background-color:pink;color:blue;font-weight:bold;';
}
}
});As you can see, we set background-color (background color) to pink (pink) and text color to blue (blue) based on some conditions.