Javascript debugging method under Firefox
May 30, 2021 Article blog
When you break the point, refresh the page, the page stays at the breakpoint, press the F10 button, let the code continue, and see all the variable information appear in the back variable window. W hen you break the point, refresh the page, the page stays at the breakpoint, press the F10 button, let the code continue, and see all the variable information appear in the back variable window. Today has nothing to do with the Firefox under the javascript debugging method looked at, recorded here, I hope to help you.
The code page we're using this time is the code for the document to get the object by the name property in the object blog post.
<html>
<head>
<title>getElementsByName</title>
</head>
<body>
<form id="form1" action="#">
<a href="http://www.baidu.com/" name="clj" >百度</a></br>
<a href="http://www.google.cn/" name="clj" >谷歌</a></br>
<a href="http://www.gougou.com/" name="clj" >狗狗</a></br>
</form>
<script> <!--getElementsByName-->
var hrefs = document.getElementsByName("clj");
for (var i=0;
i < hrefs.length; i++) {
var aHref = hrefs[i]; //
var aHref = hrefs.item(i);
IF (ahref.innerhtml == "Baidu") {
alert(aHref.href); break;
}
}
</script>
</body>
</html>
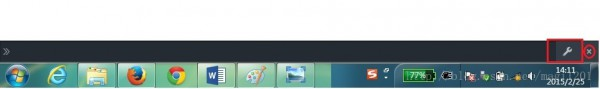
Open the page with Firefox browser, open the browser's toolbar, find the developer options button, click Enter, check the developer toolbar
Click the tool identification for the developer option to go to the viewer page
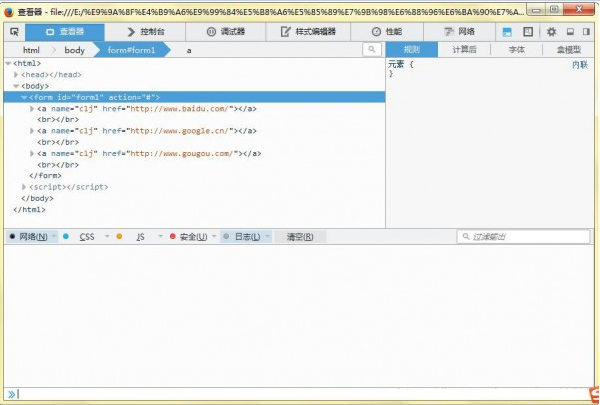
Click the tool identification for the developer option to go to the viewer page
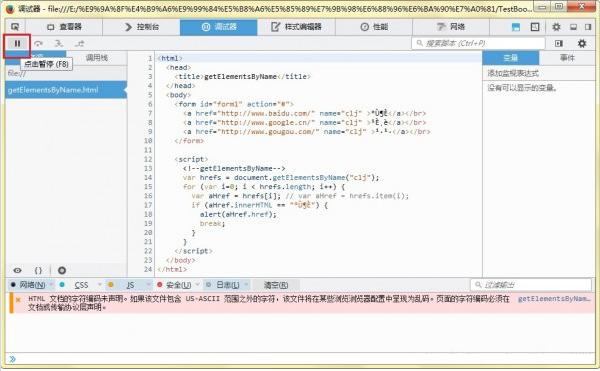
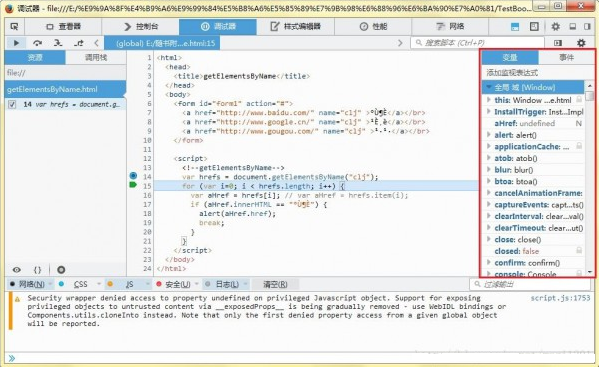
Click the Pause button, click the button status changes, while the three debugging steps on the right become operational, the role of the debugging steps can be referred to the IE browser javascript debugging section of the lecture. A
t the same time, break the point above the line of code.
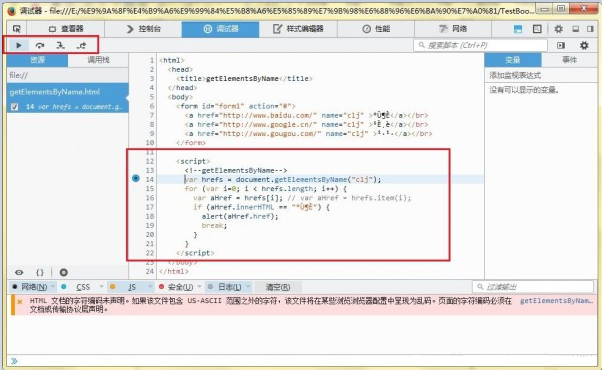
After clicking on the breakpoint, the code automatically enters the debug state, cancels the breakpoint, and the code runs directly past.
After breaking the point, refresh the page, the page will stay at the breakpoint, press the F10 button, let the code continue, see the rear variable window appear all the variable information.
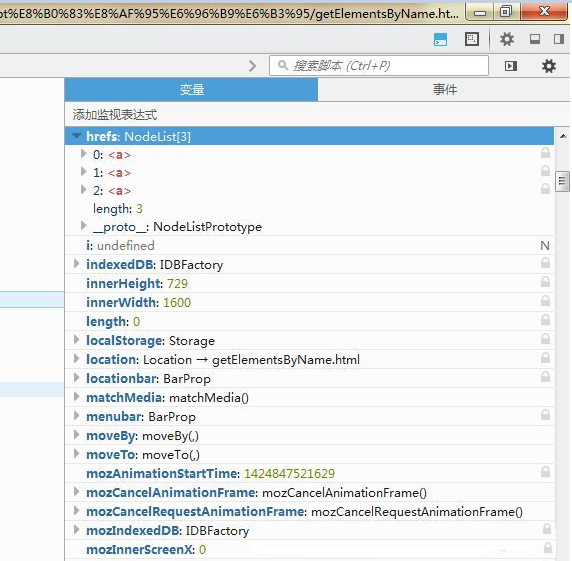
Click on the hrefs variable to see each object of the collection property, 3 objects are hyperlinks, basically the same as IE browser debugging.
Click on the first object, and when the object expands, something like object property information appears
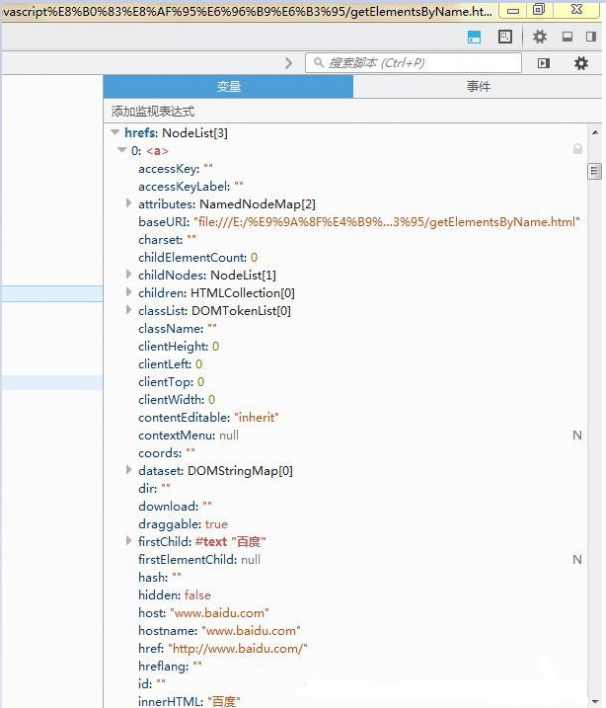
At this point, firefox browser javascript debugging is basically over.