Get started with Tableau
May 26, 2021 Tableau
Table of contents
In this tutorial, we'll do some basic work in Tableau to familiarize ourselves with the interface. C reating any Tableau data analysis report involves three basic steps. They are given below.
- Connect to a data source: It involves locating the data and reading the data using the appropriate type of connection.
- Select dimensions and measures: This includes selecting the desired columns from the source data for analysis.
- Apply visualization techniques: This involves applying the required visualization methods, such as a specific chart or graph type, to the data being analyzed.
In this tutorial, we'll use Tableau to install the sample dataset that came with it, calledample -superstore.xls. F ind Tableau's installation folder and go to My Tableau Repository. Below it you'll find the files above in datasources, my Tableau repository, and the data source, zh_CN-China
Connect to a data source
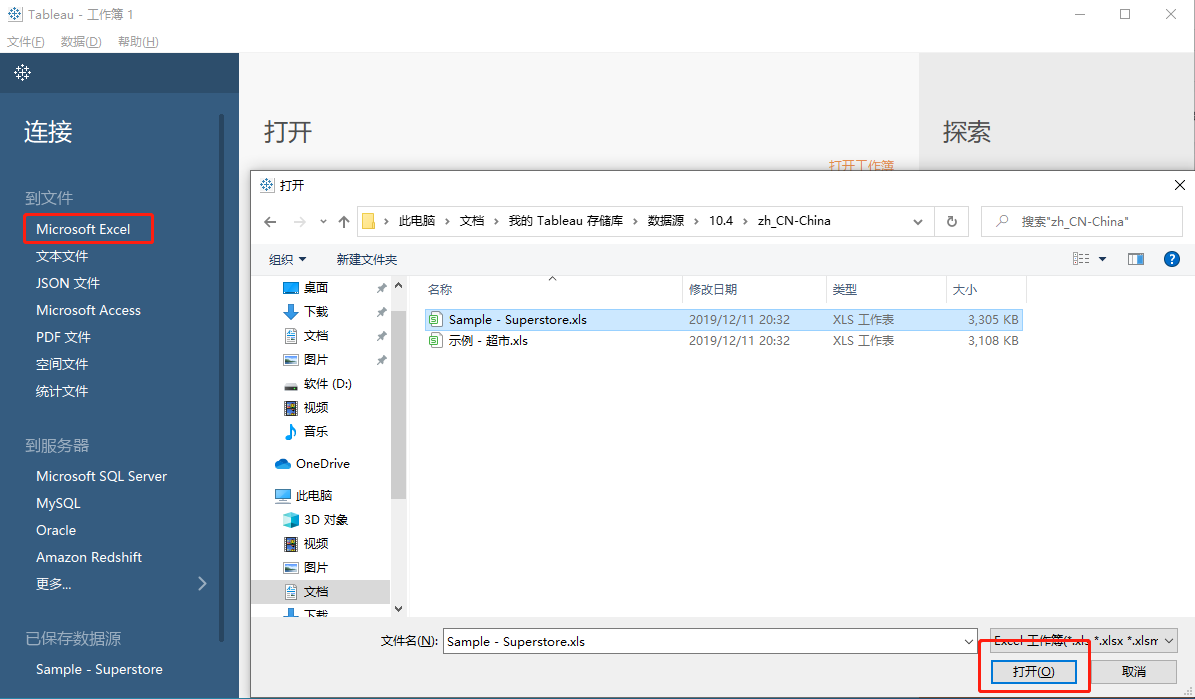
Open tableau, select Excel below the link, select Tableau's own data source Sample - Superstore in the pop-up .xls, click Open
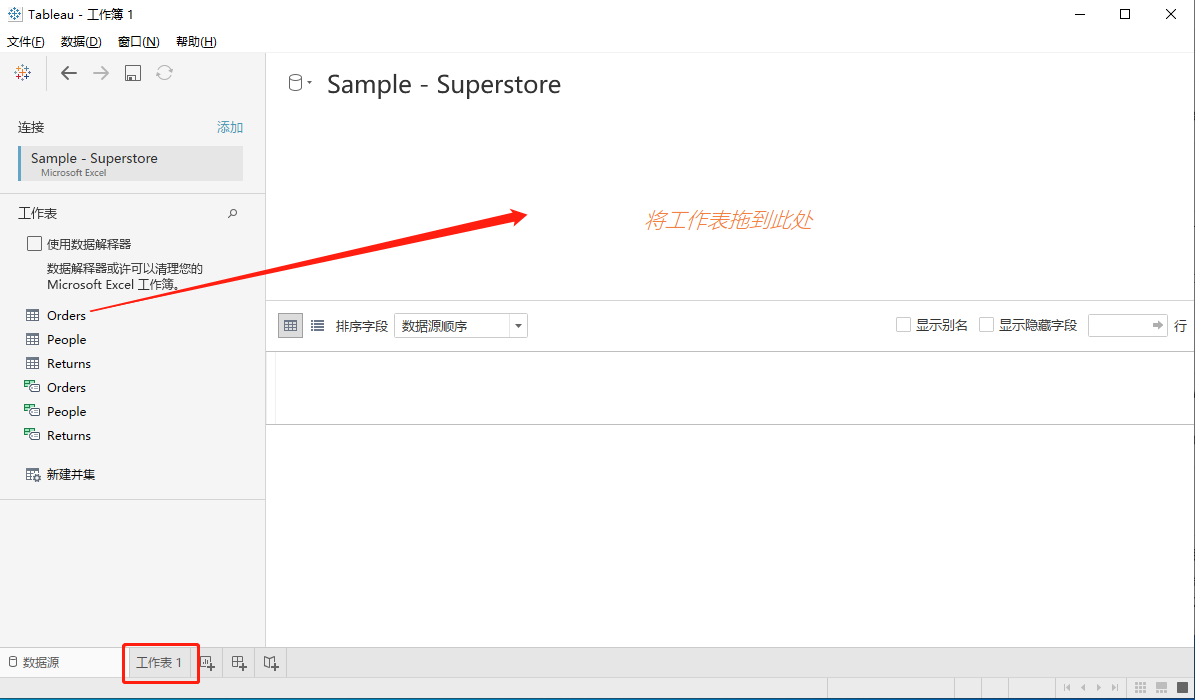
There are three tables on the left side of the figure, drag the orders table to "Drag the worksheet here" and then click on the lower left corner, Worksheet 1
Select dimensions and measures
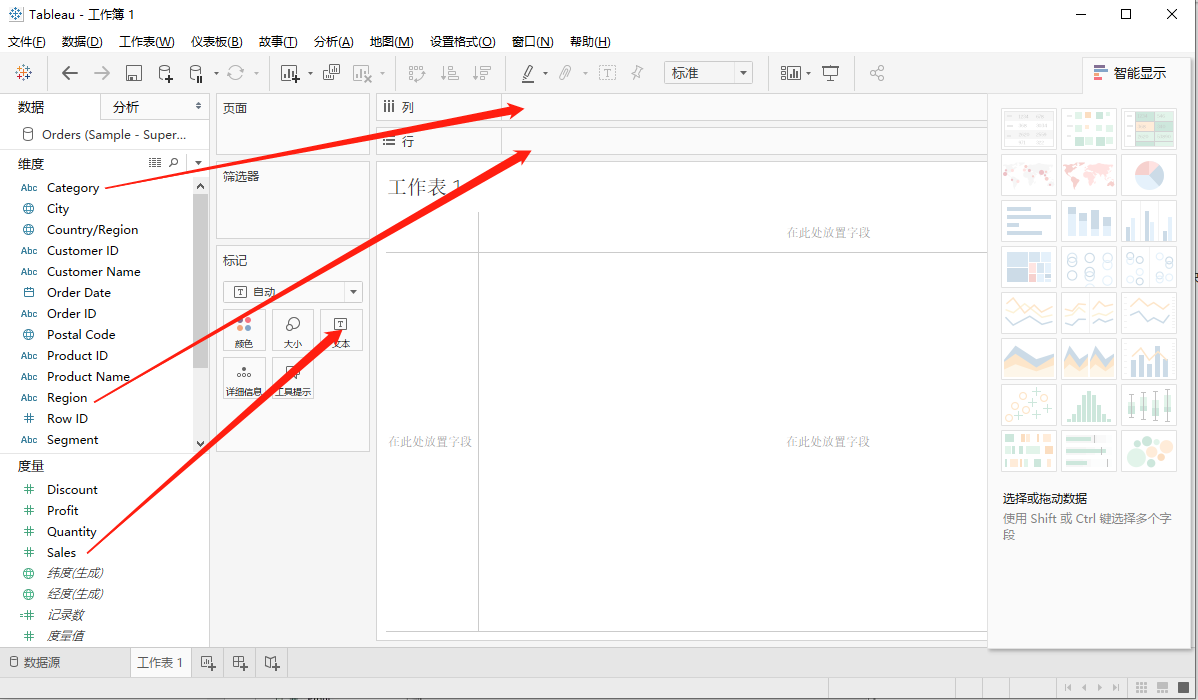
Dimensions are descriptive data, while measures are numeric data;
Find Category and Region in the dimensions and drag and drop them as shown;
Sales is found in the measure, dragged and droped as shown, and the results show the total sales for each category for each region.
Apply visualization techniques
In the last step, we saw that the data is available only as numbers. W e must read and calculate each value to determine performance. But we can think of them as charts or charts with different colors to make judgments faster.
We drag and drop the sum (sales) column from the Mark label to the column shelf. The table showing sales values now automatically changes to a bar chart.
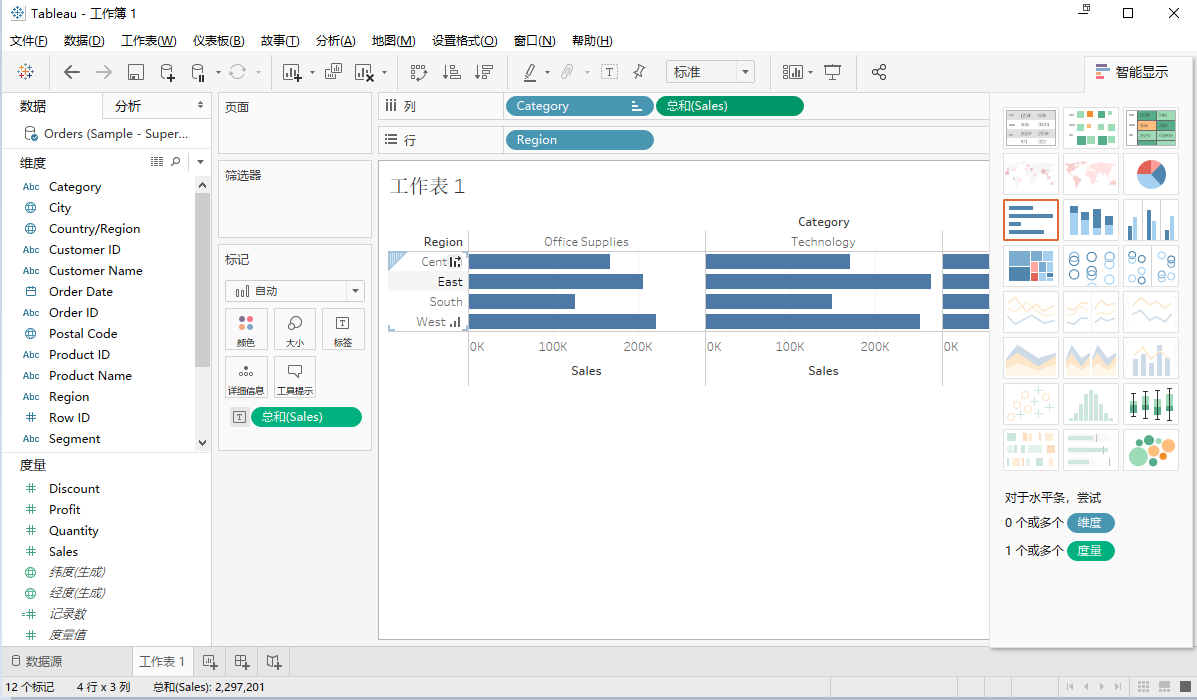
We can apply another technique, add another dimension to the existing data, and add more color to the existing bar chart, as shown below.
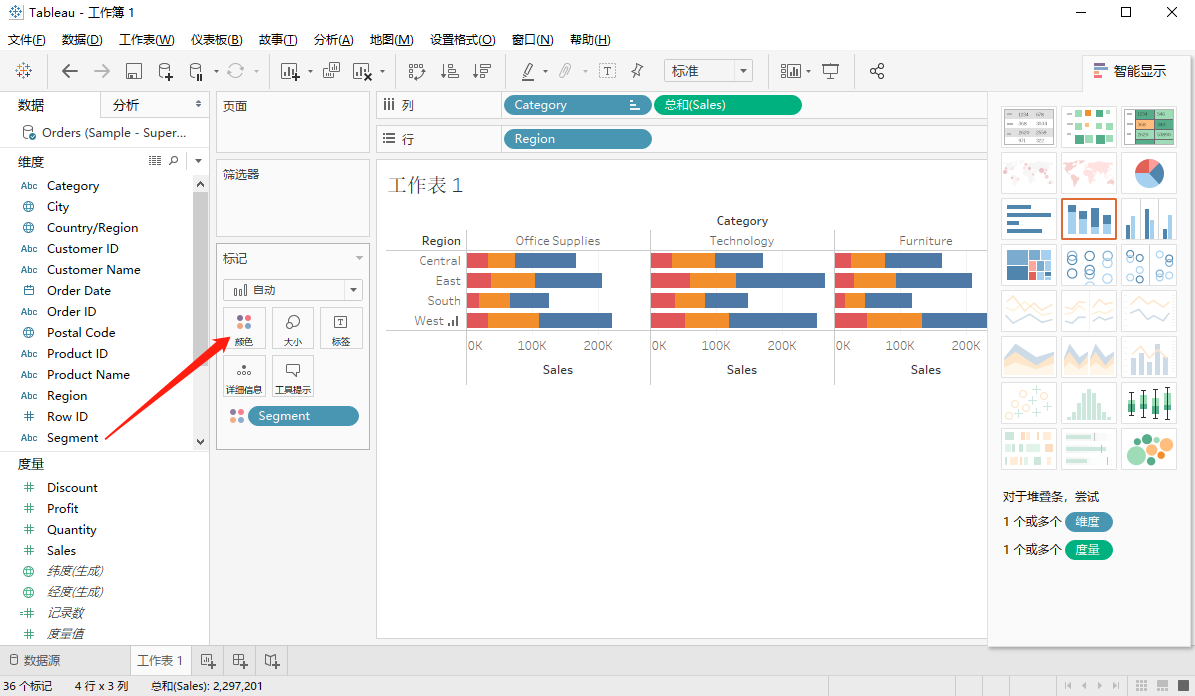
At this end, a getting started analysis is complete, and that's the basic analysis process.