Chrome Development Tools Use the Timeline
May 26, 2021 Chrome A guide to developing tools
Table of contents
2. Overview of the timeline panel
5. About transparent or light gray boxes
13.. DOMContentLoaded and Load event tags
14.. Position the forced sync layout
16.. The coloring of the timeline is nested with the recording event
17.. Filter and search records
18.. Zoom in on the timeline section
20.. The user-generated event schedule
Use the timeline
The Timeline panel lets you record and analyze all activities running in your application. It starts in the best place for your application to be aware of investigating performance issues.
Overview of the timeline panel
The timeline has three main sections: the overview section at the top, the record view, and the toolbar.
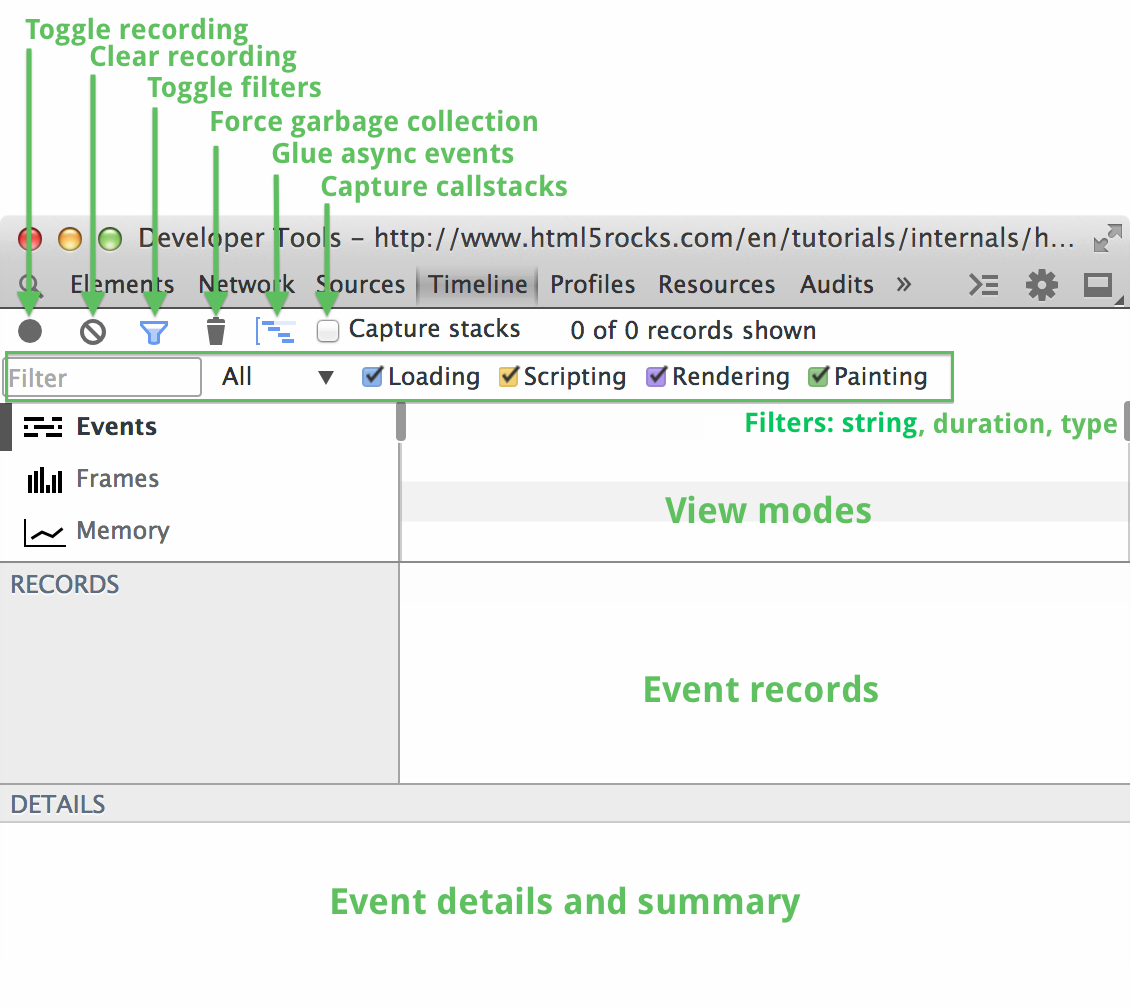
- To start or stop recording, press the recording button to switch (see Make a recording).
- Press the Clear Record button to clear the record from the timeline.
- Glue asynchronous event mode makes it easier for you to associate the cause of asynchronous events (see About Nested Events).
- You can filter the records displayed in the timeline based on your type or duration (see Filter and Search Records).
During the recording process, the Waterfall demo view is added to each event record in the record. R ecords are divided into four categories: loading, scripting, rendering, and painting. These records are color-coded as follows:

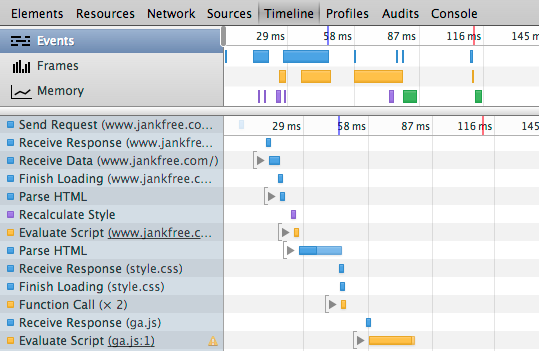
For example, the following record is loaded into the browser's HTML page. T he first record (send request) is the HTTP request used in the web browser, followed by the received response record (for the corresponding HTTP response), some receive data record (for the actual page data), and then one completes the load record. For a complete list of record timelines and their description events, see timeline event references.
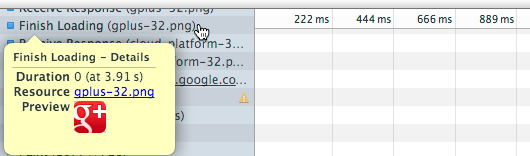
When you record a hover in a timeline, a pop-up will appear with more information about the associated event. F or example, the information shown in the screenshot below is associated with the completion load record of the image resource. The reference instructions for timeline events can be used for the details of each record type.
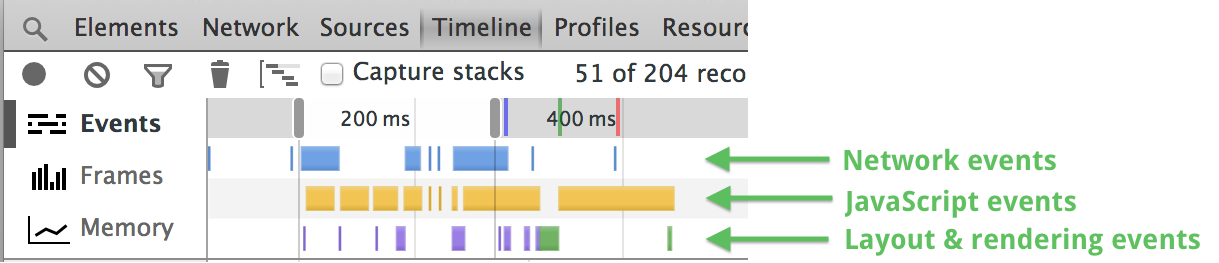
In addition to detailed recording, you can check one of the three modes of recording:
- Activity Mode displays all logged events by event category.
- Frame mode displays the rendering performance of the page.
- Memory mode shows the memory usage of your page over time.
Active mode
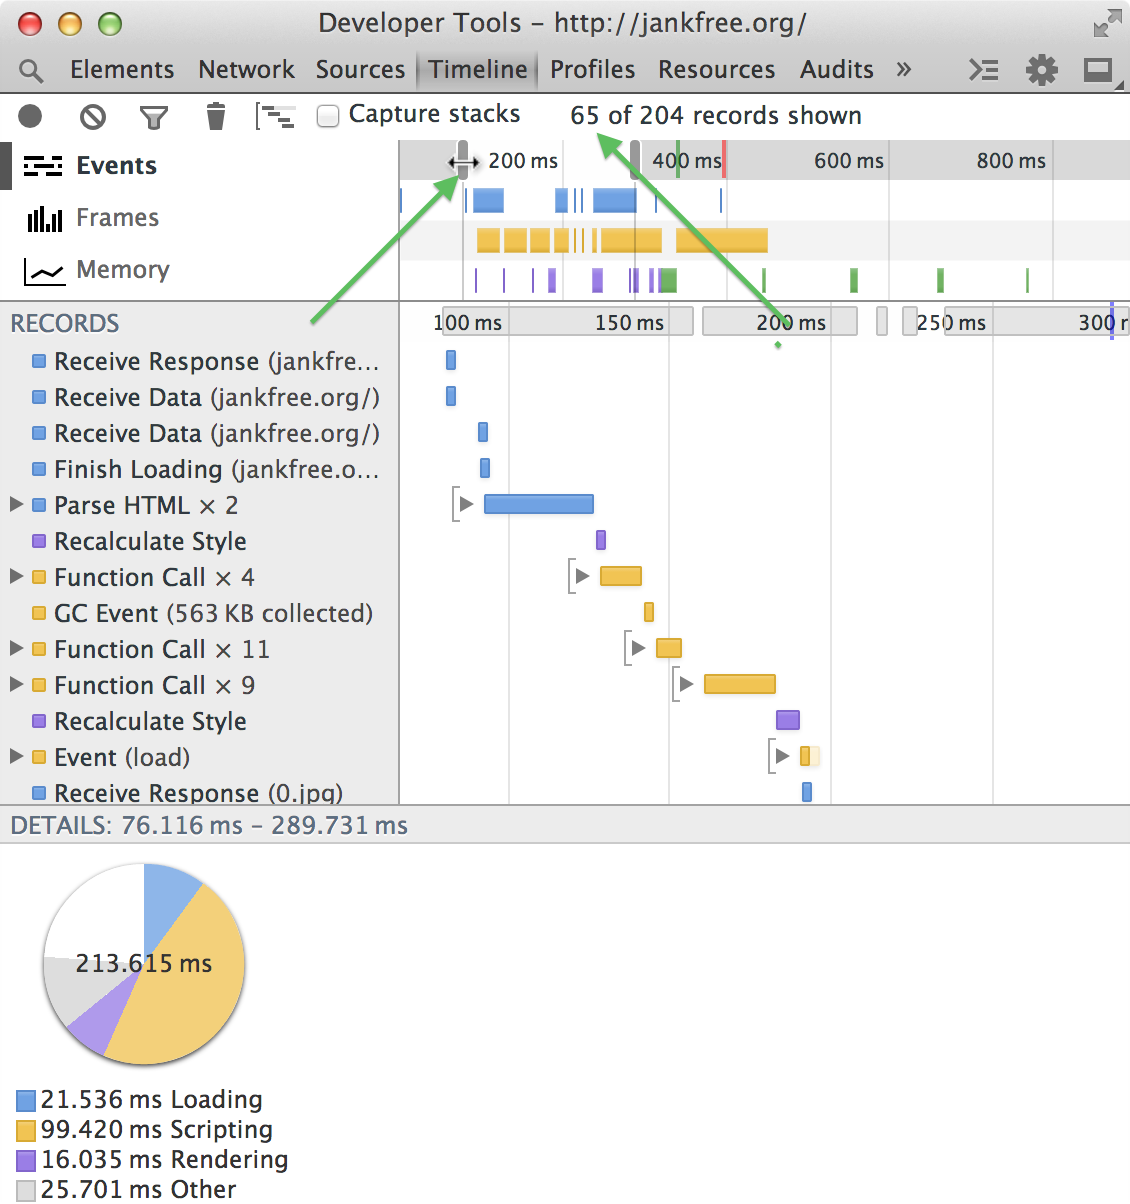
This activity mode provides all events captured during recording by type. A t a glance, you can see what type of task your application spends the most time on. In this view, the length of each horizontal bar corresponds to the time the event occurs to complete.
When you select a time range from the event view (see Closer in the Timeline section), the record view is limited to showing only those records.
Frame mode
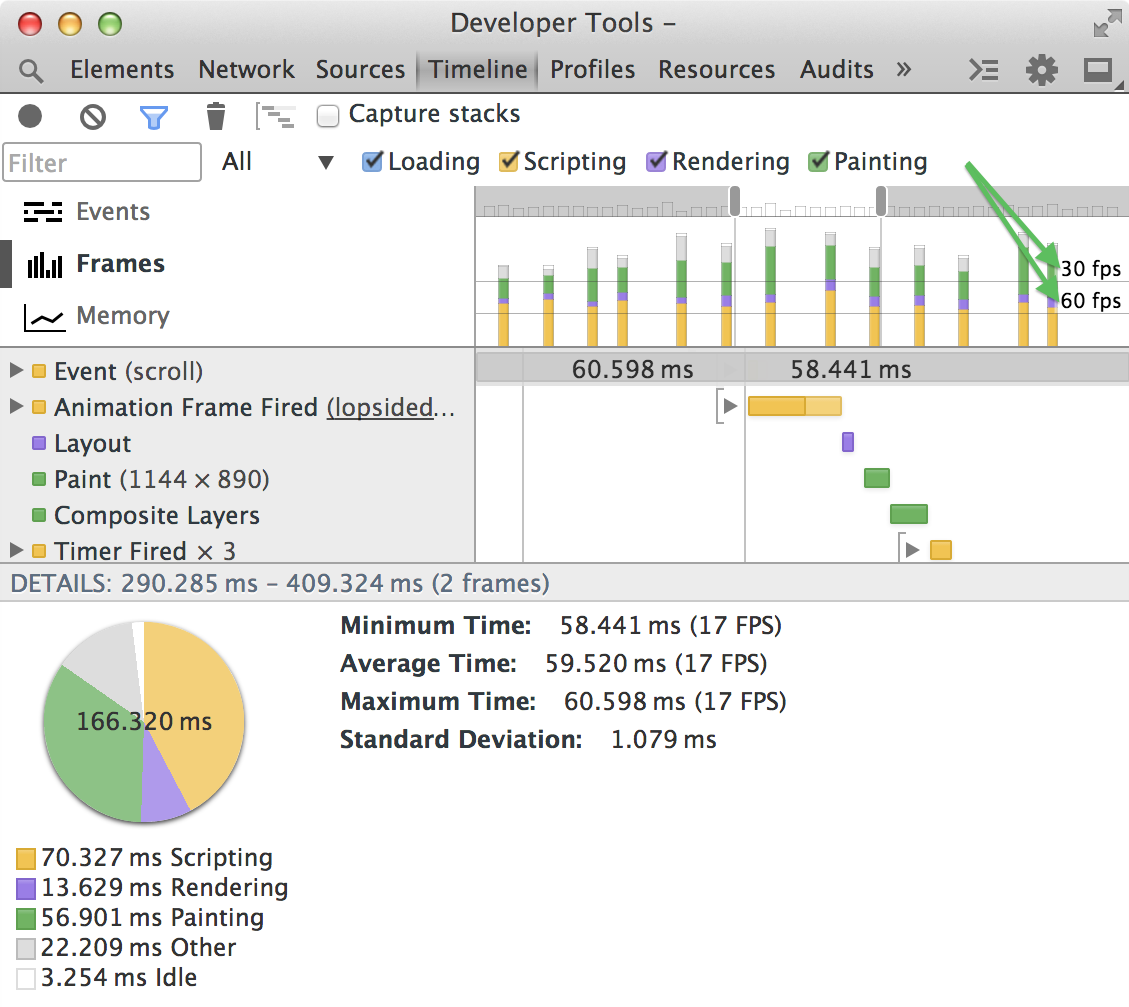
Frame mode provides insight into the rendering performance of your application. " Frames" represents the browser must do the work of drawing content displays, running JavaScript individual frames, handling events, updating DOMs and changing style, layout and painting pages. O ur goal is for your application to run at 60 frames per second (FPS), which corresponds to the 60Hz refresh rate of most (but not all) video displays. Therefore, your application has approximately 16.6 milliseconds (1000 milliseconds/60) to prepare for each frame.
The entire frame horizontal represents the target for watching the 60 FPS and 30 FPS frame rates. T he height of a frame corresponds to the time it takes to render the frame. Color fills each frame shows the percentage of time taken for each type of task type.
Rendering a frame time is recorded in the top view. If hovered over the displayed time, additional information is displayed about the frame, including the time spent on each type of task, CPU time, and calculated FPS.
See Timeline Demo: Diagnostics and Repair Sync Forced Layout Using Frame Mode demonstration.
About transparent or light gray boxes
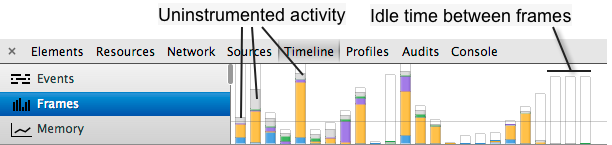
You may notice an area where the frame is light gray or transparent (hollow). These areas represent:
- Not by Dev Tools meter activity
- Displays the idle time between refresh cycles.
Below, both tool activity and idle time are displayed in the recording frame.
      想在酒吧内的空白空格更多的细节?如果你碰到GPU瓶颈,阅读

       浏览器工程师纳特杜卡的解释

      ,它描述了如何评估。
About the green column
Painting is a two - step process that includes: drawing calls and grating scanning.
-
Draws the call. T his is the list you want to draw, which comes from CSS applied to the element. T he list of sweepstakes is no different from calling, Canvas elements: MOVETO, LineTo and FillRect. Although they have different names on the back end of Skia,Chrome's paintings, this is a similar concept.
- Grating . These draw calls step and fill in the actual pixels converted to a synthetic buffer that can be uploaded to the GPU.
So what is the difference between a stable green bar and an empty green bar in the background?
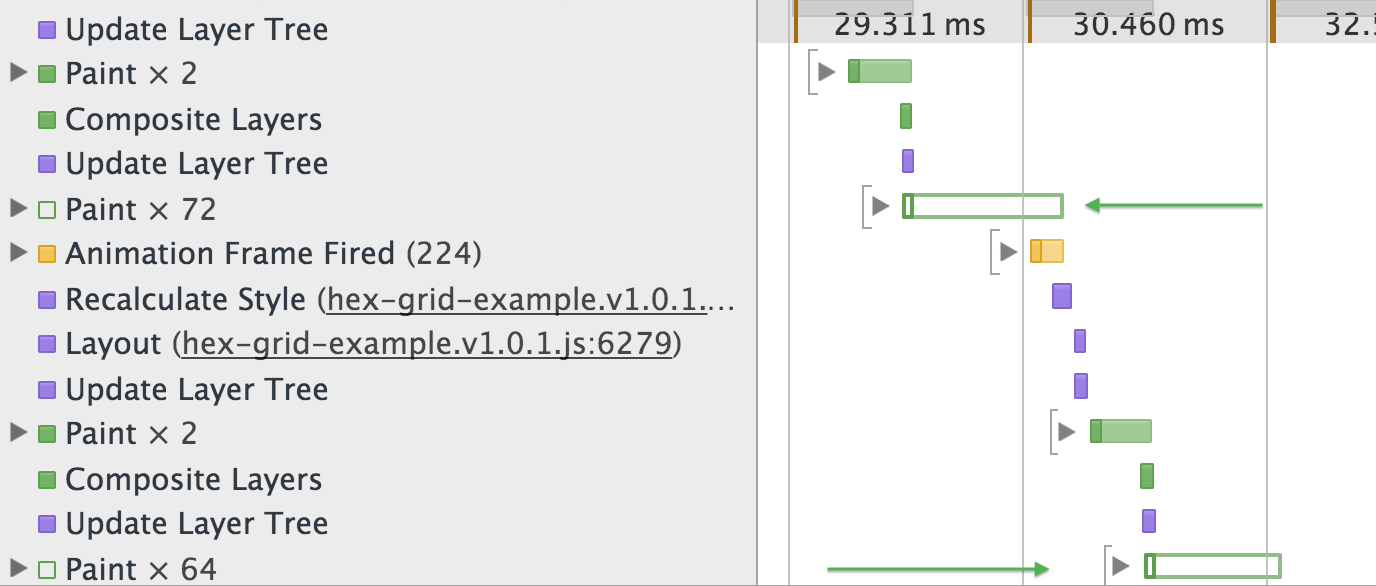
-
Green Real Bar Record Chrome Raffle Phone. T his occurs next to the main thread JavaScript, on the calculation style and layout. The synthesizer thread gets the grouping of data structures passed by the drawing call.
- An empty green bar is grating. A worker thread was spawned by a synthesizer to handle this.
Both are paint, and they just represent different sub-tasks for the job. I f you have performance issues, you can see what properties you change. T hen, check to see if there is a synthesizer that will do the same. CSS triggers can help determine a solution to this.
View frame rate statistics
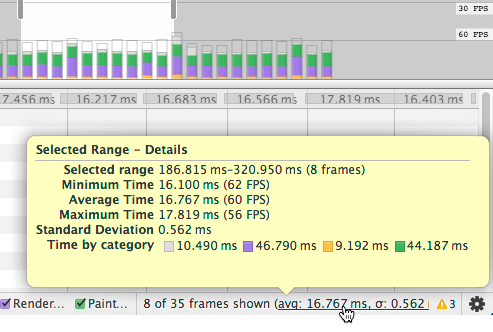
The average frame rate, represented by its standard deviation, is displayed along the bottom of the selected frame range of the timeline panel. If you hover over the average number of frames, it seems to pop up with more information about frame selection:
- Selected Range - The selected time range and the number of frames selected.
- Minimum time - The minimum time of the selected frame and the corresponding frame rate in parentheses.
- Average time - The average time of the selected frame, and the corresponding frame rate in parentheses.
- Maximum time - Maximum time selected range, and the corresponding frame rate in parentheses.
- Standard deviation - the amount of average time change calculated.
- By Category Time - The amount of time spent processing on each type, color-coded by type.
Memory mode
The memory view shows counters that over time the application uses memory graphics and maintains the number of documents, DO nodes, and event listeners saved in memory (i.e., not garbage collected).
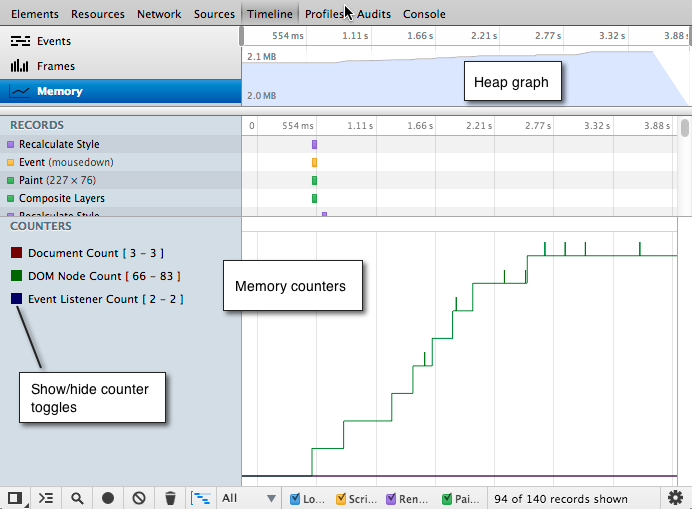
Memory mode doesn't tell you exactly what caused the memory leak, but it can help you determine which events in your application might cause the memory leak. You can then use heap sniffing to determine the specific code that caused the leak.
A manufacturing record
To record, start recording, interact with the application, and then stop recording. It helps you know in advance what kind of activity you want to record - for example, page loading, the performance of scrolling through image lists, and so on, and then stick to the script.
Recording:
- Open the page you want to record.
-
Open the timeline panel and start recording one of the following:
- Click the circular recording button at the bottom of the timeline panel.
- Press the keyboard shortcut Ctrl plus E, or Cmd's plus E on the Mac.
- The recording button turns red during recording.
- Perform any necessary user actions to record the required behavior.
- Press the current red recording button, or repeat the shortcut to stop recording.
Record the page load
A common task is to log page loads from the initial network request. Keyboard shortcuts are useful in this case because they let you quickly start recording, reload pages, and stop recording.
Record page loading:
- Any page that opens in a new label or window.
- Turn on the timeline and start recording by pressing CMD plus E (Mac) or ctrl plus E (in Windows/Linux).
- Quickly press CMD plus R or Ctrl plus R to reload the browser page.
- When parking, the page completes a record of loading (which appears to be marked with a red event).
Your record should look like this. The firsttrecord (send request) is a record of the HTTP request used in the web browser, followed by a received response to the corresponding HTTP, followed by a record of one or more received data, and an HTML record that completes the load and resolution.

See The Timeline Event reference for more information about each record type.
Tip recording production
Here are some tips for recording:
- Keep records as short as possible. Shorter general recordings are easier to analyze.
- Avoid unnecessary actions. T ry to avoid actions that are redundant and you want to record and analyze activities (mouse clicks, network loads, etc.). For example, if you want to record an event that occurs, you click the "Login" button, do not scroll the page, load the image, and so on.
- Disable the browser's cache. When recording network operations, it is a good idea to disable the cache of browsers in the DevTools settings panel.
-
Disable the extension.
T
he Chrome extension can add unrelated noise to the app's schedule recording.
You can do one of the following:
- Open a browser window in Incognito mode
- Create a user profile to test a new browser.
Analyze timeline records
This section provides tips for analyzing timeline recordings.
View more information about the record
When you select a record in the timeline, the details pane displays additional information about the event.
All types that exist in some details, such as duration and CPU-time events, while others apply only to certain event types. Information details about those various records include seeing timeline event references.
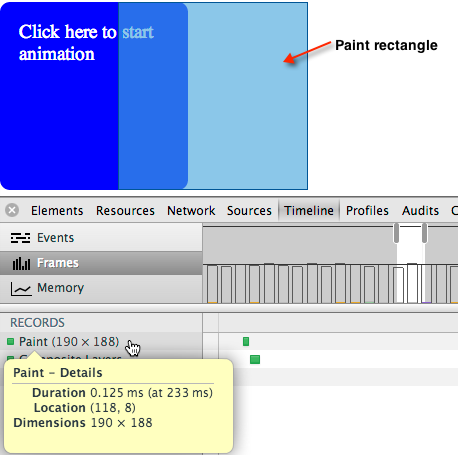
When you select a drawing record, DevTools emphasizes the area of the screen updated with a blue translucent rectangle, as shown in the following image.
DOMContentLoaded and Load event tags
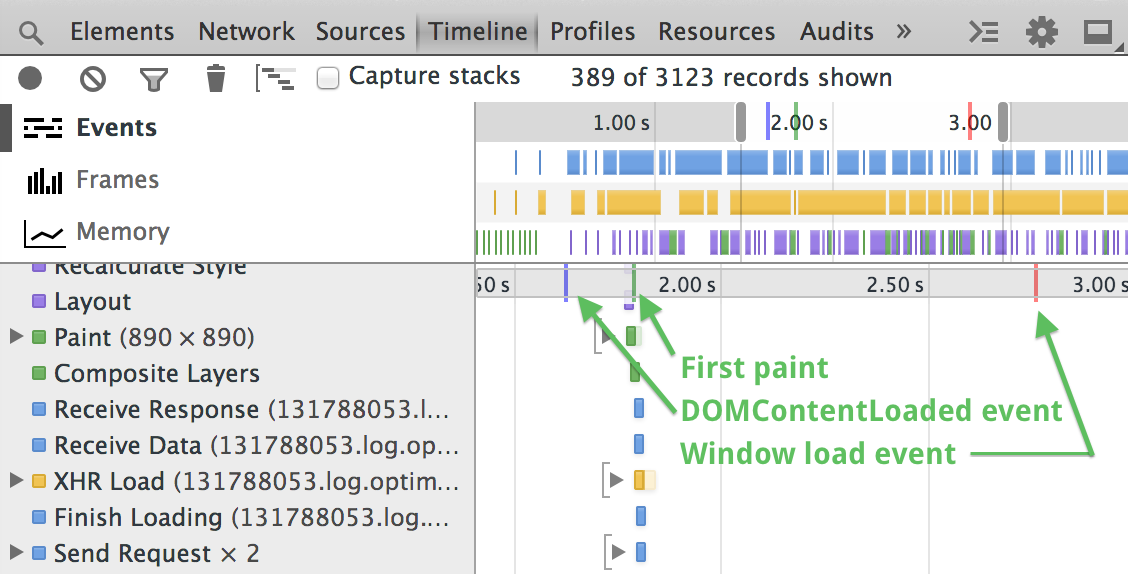
The timeline labels each record with blue and red lines indicated by the DOMContentLoaded and Load Event browsers, respectively. T he DOMContentLoaded event is triggered when the DOM content of all pages is loaded and analyzed. The resources (images and CSS files, etc.) of all documents burned by the load event at once have been fully loaded.
Position the forced sync layout
Layout is the process by which Chrome calculates the position and size of all elements on the page. T ypically, Chrome is "lazy" in performing an update layout from your app in response to CSS or DOM. T his makes Chrome bulk style and layout changes, rather than reflecting to each requirement. H owever, the application can force Chrome to perform the layout immediately and synchronously by querying the values of component performance such as element.offsetWidth. These so-called "forced synchronization layouts" can be a big performance bottleneck if repeated frequently or by large DOM trees.
Timeline identification when your application causes forced asynchronous layout and marks these records with yellow warning icons (!). ) 。 When you select the record, the details pane contains a stack trace of the code for the problem.
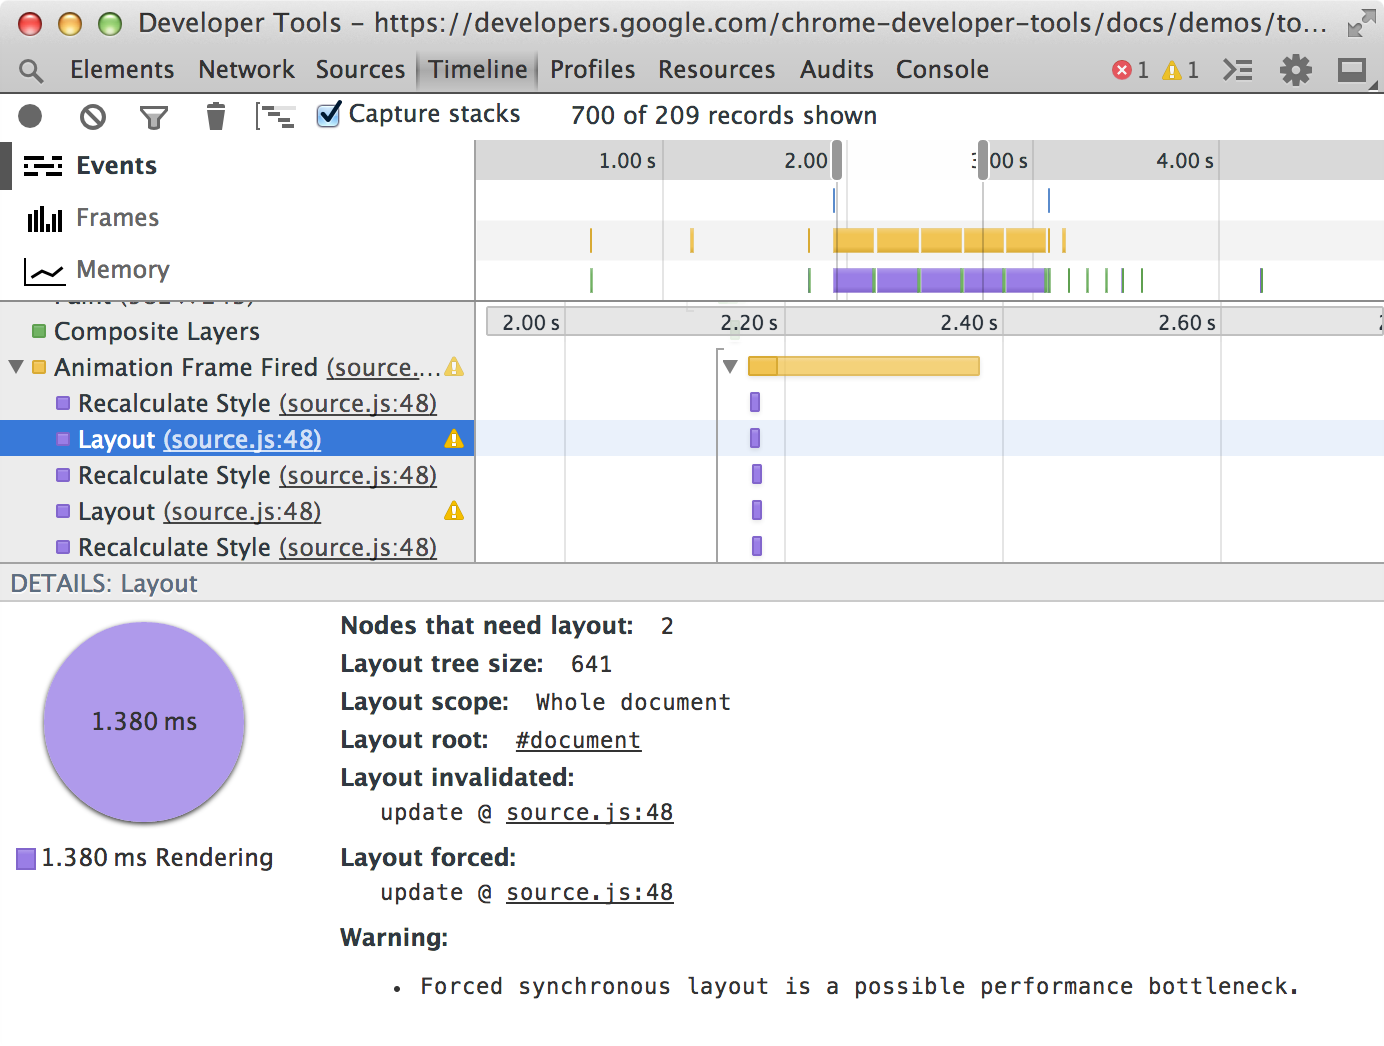
If the record contains child records for the mandatory layout, the parent record is marked with a slightly darkened yellow icon. Expand the parent record to determine the child record that caused the forced layout.
Forced Synchronization Layout demonstrates that demonstrationof detects and fixes such performance issues.
About nested events
Events recorded in the timeline are sometimes visually nested below another event. E xpand the Parent event to see its nested Child event. There are two reasons for timeline events:
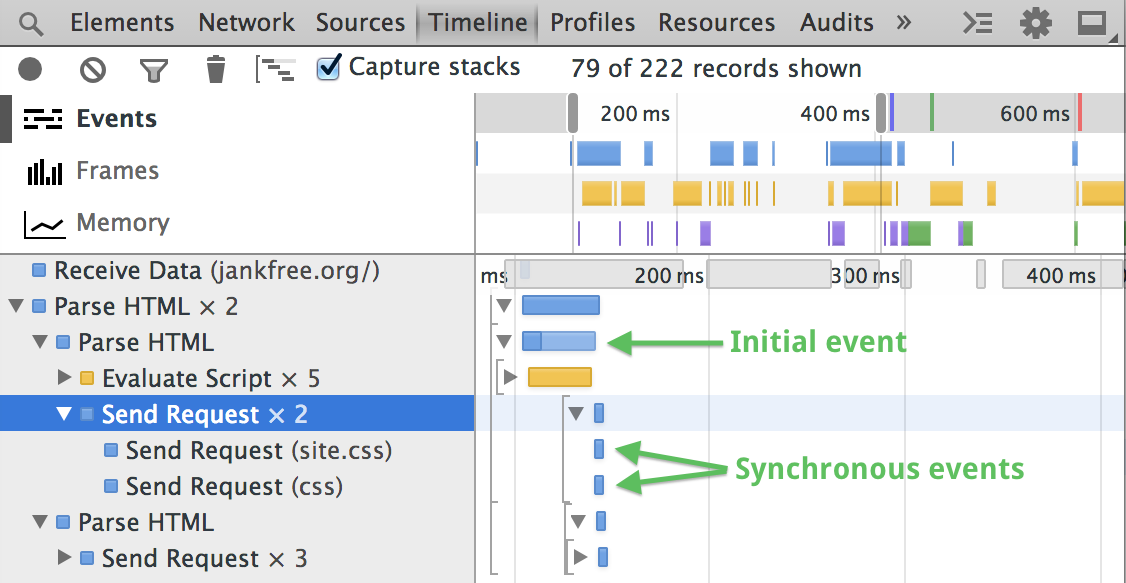
- Synchronized events occur during the processing of previous events. E ach event internally produces two atomic events, one for the beginning and one for the end, which are converted to a single "continuous" event. Other events that occur between these two atomic events become external events for children.
The following screenshot shows an example of a nested synchronization event. I n this case, the browser is parsing some HTML (in resolving HTML events) when it finds that several external resources need to be loaded. Chrome forward requests those that have completed parsing, so sending request events appears as parsing HTML events for children:
The coloring of the timeline is nested with the recording event
The color code of the timeline bar is as follows:
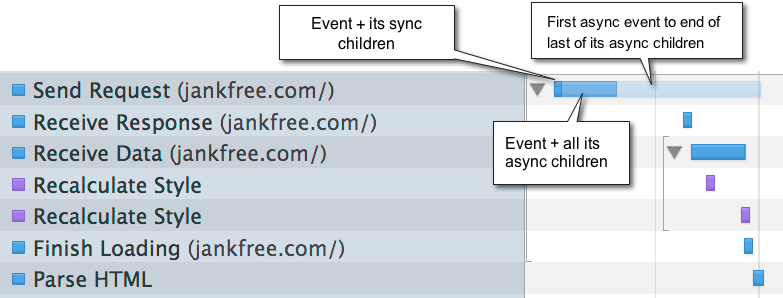
- The first, darkest part of the axis bar represents how long the parent event and all of its synchronized children have gone.
- Next, slightly white indicates the event and the CPU time that all of its asynchronous children bring.
- The whitest bar represents the end time from the beginning of the first asynchronous event to the end of its asynchronous child.
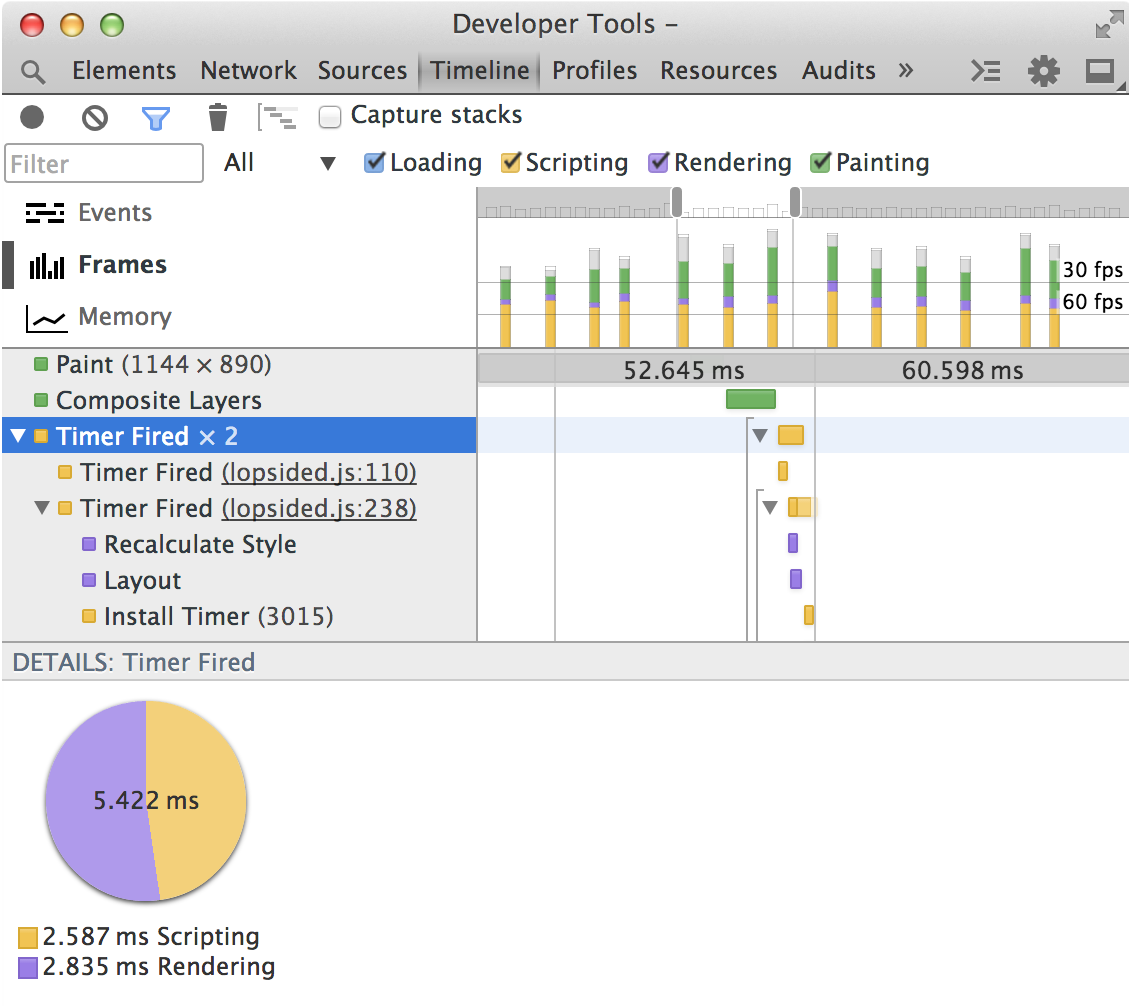
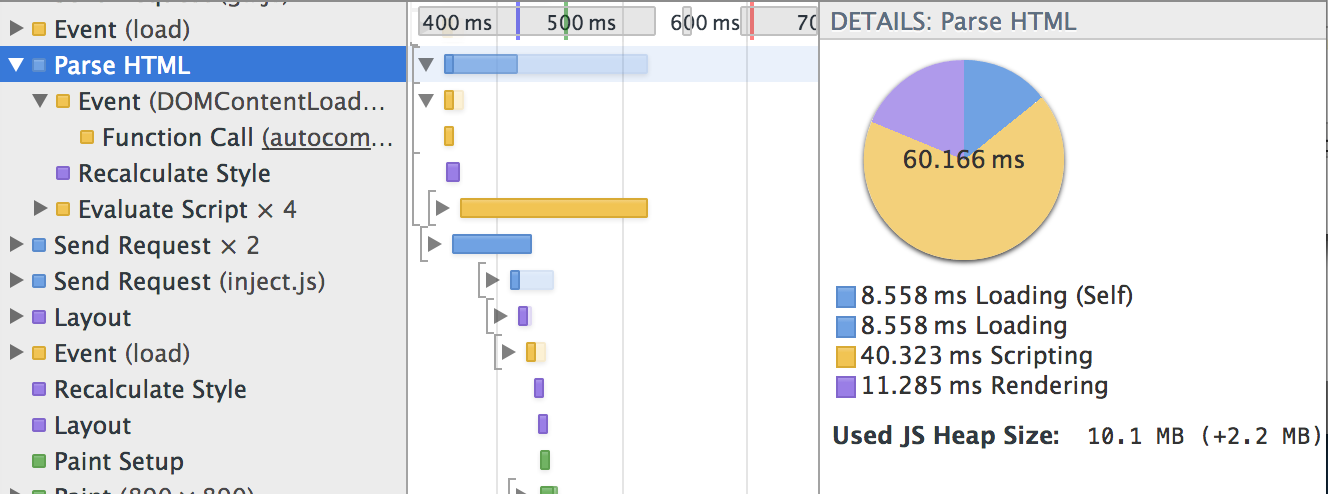
Selecting a parent record appears in the details pane as follows:
- A pie chart summarized and visualized by the text event type.
- Second, the JS heap size is recorded at this point, and the effect of what this operation is is the heap size.
- Additional details related to the event.
Filter and search records
You can filter records that are displayed by their type (showing only load events, for example), or display records that are longer than or equal to 1 millisecond or 15 milliseconds. You can also filter the view to display events for matching strings.
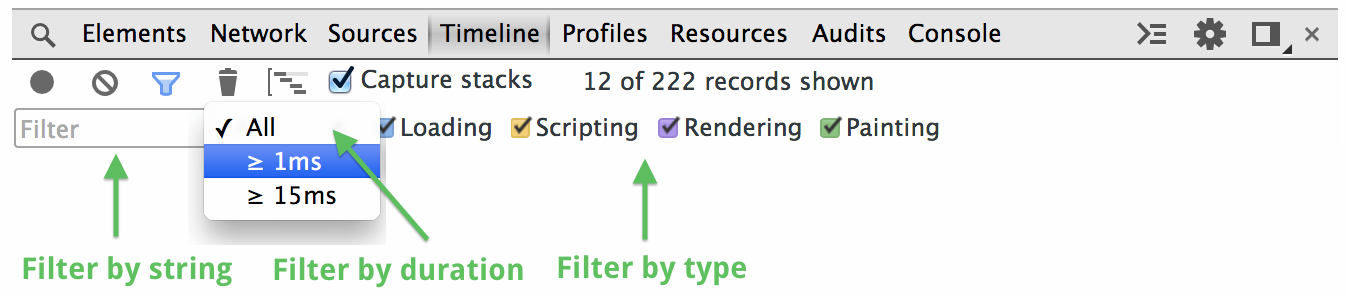
While looking at all the events, you may need to find one, but keep a kind of surroundings. I n this case, you can find no filtering. Press ctrl-F (window/Linux) or Cmd's plus-F key (Mac), and the timeline has focus to display those that contain search terms.
Zoom in on the timeline section
To make it easier to analyze records, you can "zoom in" on an overview of the timeline, reducing part of the record view for the corresponding time scale.
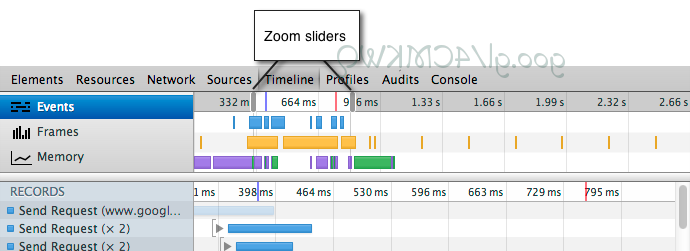
To zoom in on the timeline section, do one of the following:
- In the overview area, drag the timeline to select with your mouse.
- Adjust the gray slider in the ruler area.
Here are a few more tips for working with timeline selection:
- Matte records the area between the two skate strips that are currently selected by dragging.
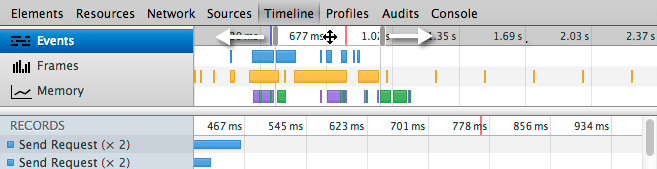
-
Users of the trackpad:
- Swipe to move the current timeline selection to the left or right fingers.
- Swipe up or down with two fingers to expand or shrink the current timeline selection.
- Scroll the mouse wheel while up or hovering in a timeline to select the expand and shrink selections down.
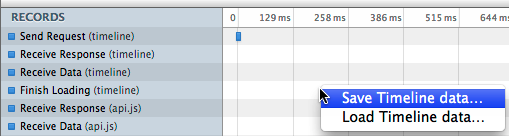
Save and load records
You can save a timeline record as a JSON file and later open it in the timeline.
To save a timeline record:
- Right-click or Ctrl-click (Mac only) timeline, then choose to save timeline data... or press Ctrl-S-key keyboard shorcut.
- Select a location to save the file, and then click Save.
To open an existing timeline recorded file, do one of the following:
- Right-click with the mouse or click on the Load timeline data..., or press the Ctrl-O shortcut.
- Find the JSON file and click Open.
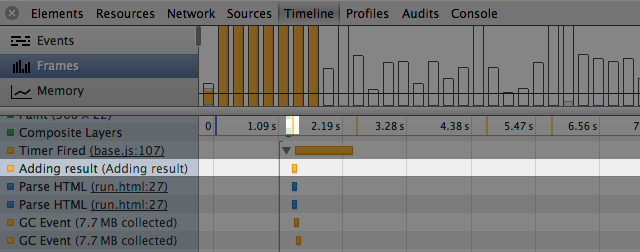
The user-generated event schedule
Applications can add their own events to timeline recordings. Y ou can use the theconsole.timeStamp() method to add an atomic event to the record, theconsole.time() and console.timeEnd() methodsto to mark the time code execution range. F or example, the record console.timeStamp() below has been used to display the Add Results event. View timeline Use the console for more information tags.
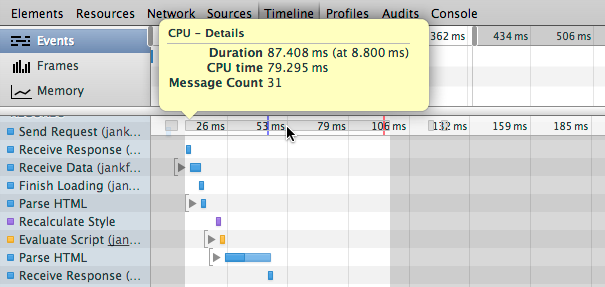
View CPU time in the recording
You'll see a light gray bar that appears above in the timeline record, indicating that the CPU is busy. H overing around a CPU bar highlights the timeline area during this period, the CPU is active (see figure below). T he length of a CPU rod is usually the sum of all the (highlighted) events below it in the timeline. If the two do not match, this may be due to one of the following:
- Check other pages running on pages of the same thread (for example, two labels are open from the same location, and the same site does something in a setTimeout() call).
- UN-instrument activity.
Timeline event reference
This section lists and describes the records generated during recording by each type of type, and their properties.
Common event properties
Some details exist in all types of events, while others apply only to certain event types. T his section lists the properties of different event types that are common. Performance specific to certain event types is listed in references that follow the event type.
-
A summary of the time
For nested event events, take the time of each type of event.
-
The call stack
For event events with children, take the time of each type of event.
-
CPU time
How many CPU-time-recorded events occur.
-
Details
Additional details about the event.
-
Duration (in timestamp)
after how long the case had been completed with all the children; A timestamp is a time event that occurs relative to the time of recording.
-
Self-time
How long it took to happen without any children.
-
Second-hand heap size
The amount of memory that is being used by the application is recorded in the case, and the increment of the size of the heap used in the last sample. Changes.
Load the event
This section lists events that belong to class loads and their properties
| Event | Describe |
|---|---|
| Resolve HTML | Chrome performs its HTML resolution algorithm |
| The load is complete | The network request was completed |
| Receive data | Requests for data are accepted and there will be one or more events that receive data |
| Receive a response | The initial HTTP response from the request |
| Send the request | A network request has been sent. |
Load the event property
-
Resources
The URL of the requested resource.
-
Preview
Preview the requested resource (image only).
-
The request method
HTTP method for requesting (GET or POST, for example).
-
The status code
HTTP response code
-
The type of MIME
The resource requested by the MIME type.
-
Encode the length of the data
The length of the requested resource in bytes.
Script event
This section lists the categories and nature of events that belong to the script.
| Event | Description |
|---|---|
| Animated frame shooting | A is scheduled for the animation frame to be fired, and its callback handler is called |
| Cancel the animation frame | The animated frame of Plan A is taken |
| GC event | Garbage collection occurs |
| DOMContentLoaded | The DomContentLoaded is transmitted by the browser.When this event, all the DOM contents of all pages have been loaded and analyzed. |
| Assess script | The script was evaluated |
| event | JavaScript event ("Mouse Press" or "Key", for example) |
| Function call | Top JavaScript function calls (only when the browser enters the JavaScript engine) |
| Installation timer | SetInterval () or created setTimeout () |
| Request frame animation | A requestanimationFrame () calls a new framework |
| Delete timer | Previously created timer clear |
| time | Script call console.time () |
| time's up | Scripted CalledConsole.TimeEnd () |
| Timer triggered | The timer dismisses the original use setInterval () or settimeout () |
| XHR ready state changes | XMLHttpRequest object changes |
| XHR loading | An XMLHttpRequest completion load |
Script event properties
-
Timer ID
Timer ID.
-
pause
The timeout specified by the timer.
-
repeat
Boolean value, specify that the timer is repeated.
-
Function call
The function called is called.
Rendering event
This section lists events belonging to the rendering category and its properties.
| event | illustrate |
|---|---|
| Layout invalid | Page layout is invalid by DOM |
| layout | Page layout is executed |
| Recalculation style | Browser recalls element style |
| scroll | The contents of the nested view are scrolled. |
Rendering event properties
-
Layout invalid
The layout of the stack tracking of the invalid code will be tracked.
-
Need layout node
For layout records, the node is marked as the number of re-layouts that require layout.These are usually invalid by the developer's code, these nodes, plus a path to re-layout roots.
-
Layout tree
For the record of the layout, the total number of resembled roots under the node (the node chrome starts re-layout).
-
Layout
The possible value is "part" (the boundary of the re-layout is part of the DOM) or "Overall Document".
-
Influencing factors
To recall the style, the number of elements is recalculated by the style.
-
Style invalid
For recalculation style records, providing stack tracking that causes invalid pattern code.
Painting activity
This section lists events belonging to the painting class and their attributes.
| event | illustrate |
|---|---|
| Composite layer | Rendering Engine Image Layer of Composite Chrome |
| Picture decoding | Image resource decoding |
| Picture adjustment | The image is from its native size sizes |
| paint | The composite layer is applied to a region of the display.Strong in a paint record highlights the area that has been updated |
Painting event attribute
-
Place
Paint event, x and paint rectangular Y coordinate.
-
size
Paint events, the height and width of the painting area.