Chrome Development Tools Tips and Tricks
May 26, 2021 Chrome A guide to developing tools
Table of contents
Tips and tricks
Console
Write multiple lines of commands
When you go into multi-line writing mode in the console, you can use text blocks like a standard text editor.
Shitf
Enter
you to enter multi-line mode from the console.
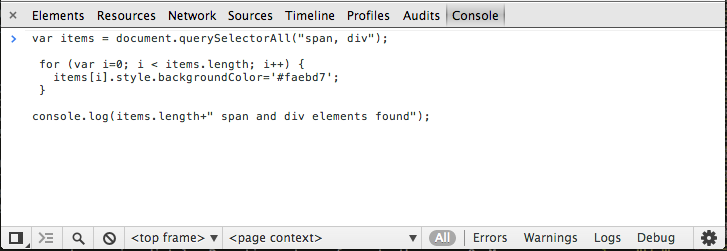
This is useful when you are writing JavaScript that is far more complex than a single line of text.
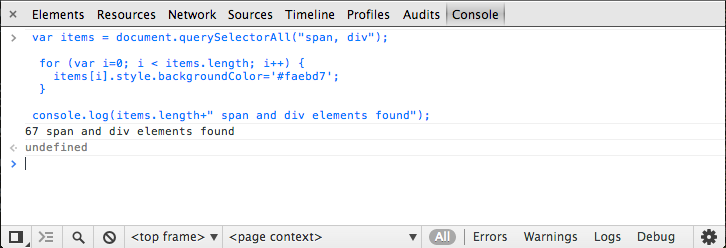
As soon as you create a text writing area, press Enter at the end
Enter
the command to start running.
For multi-line console support persistence issues, read Snippets - a feature that saves and executes specific JavaScript fragments that are available in development tools.
Check how quickly the element mode starts
Ctrl
Shitf
C
Cmd
s
Shift
s C
C
the developer tool (or choose to have it get focus) in check element mode so that you can immediately check the current page. A
ll focus is returned to the page at the same time.
On your Mac, you can do the same with
Cmd
and
Shift
C
MORE: Use the console | Developer tool documentation
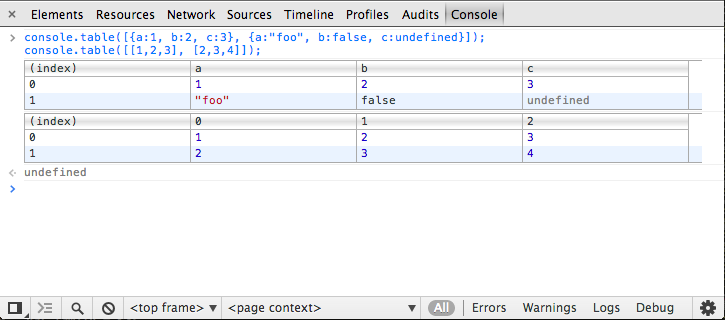
Support for console.table commands
This command records any data that uses the list layout. Here are some examples, including how to use them:
console.table([{a:1, b:2, c:3}, {a:"foo", b:false, c:undefined}]);
console.table([[1,2,3], [2,3,4]]);
There is also another
columns
parameter, which is presented as an array of strings.
Below, we define a family object that contains a lot of "People" and then select a line to display:
function Person(firstName, lastName, age) {
  this.firstName = firstName;
  this.lastName = lastName;
  this.age = age;
}
var family = {};
family.mother = new Person("Susan", "Doyle", 32);
family.father = new Person("John", "Doyle", 33);
family.daughter = new Person("Lily", "Doyle", 5);
family.son = new Person("Mike", "Doyle", 8);
console.table(family, ["firstName", "lastName", "age"]);
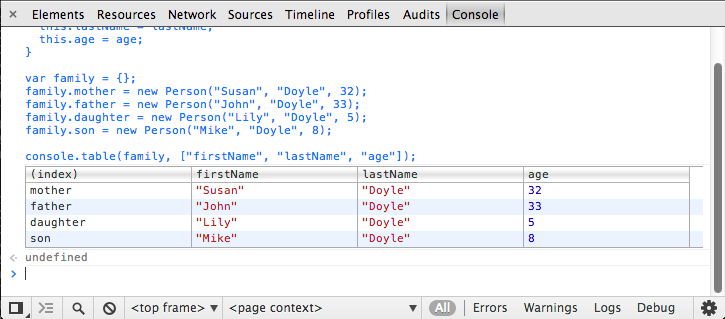
Also, if you just want to output the first two lines of this data, use:
console.table(family, ["firstName", "lastName"]);MORE: Support for console.table commands is | G+
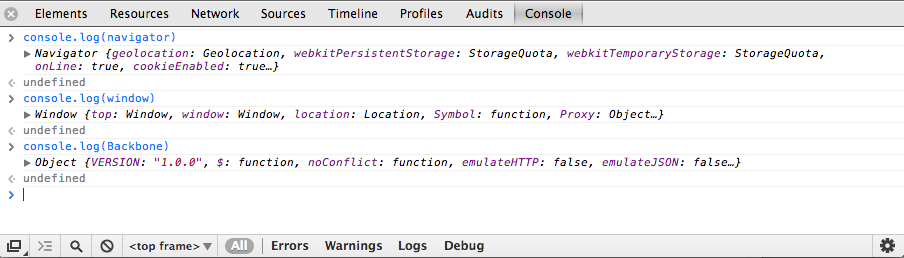
Preview the console log object
Log output objects can be previewed .log development tool using the console method() method without requiring more action.
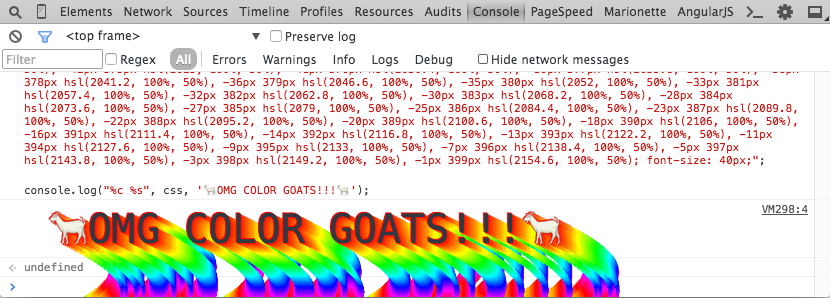
Pass multiple parameters to specify the console log style
As we said in our previous documentation, you can use %c to style your console, just as you did in Firebug. Like what:
console.log("%cBlue!", "color: blue;");Several styles are also supported:
console.log('%cBlue! %cRed!', 'color: blue;', 'color: red;');
MORE: Give logs their own style on developer | G+
Shortcuts to clean up console history
To open the console, you can quickly clean up
L
console history with
Ctrl
L
or
Cmd
s L shortcuts.
The console.clear() command in the console does the cleanup through JavaScript's console API, just like clear() under the shell.
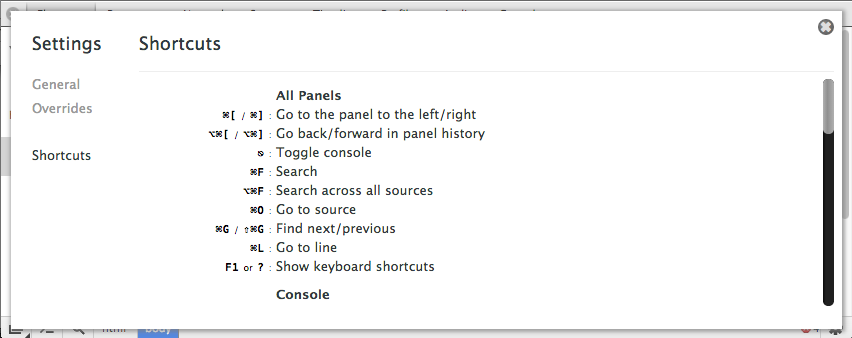
Become a keyboard ninja
On developer tools, you can use
?
open universal settings, from where you can navigate to the shortcut panel to see all the
supported shortcuts
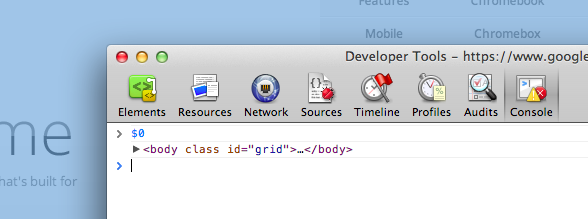
Use elements through the console
Select an element and output $0 in the console, which will be executed using a script. If you already have a jQuery object on this page, you can use $($0) to re-select the elements on this page.
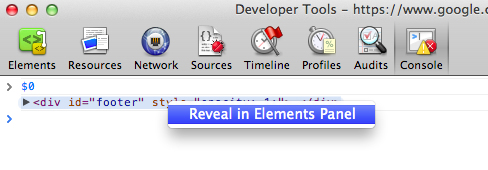
You can also right-click on any element and click
Reveal in Elements Panel
so you can find it in the DOM.
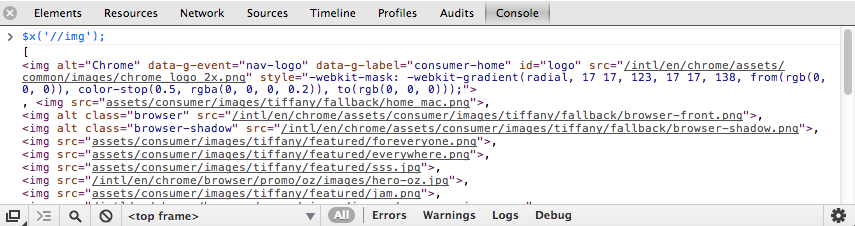
Query the DOM with the XPath expression
XPath is a query language that selects nodes in a document, typically returning a collection of nodes, strings, booleans, or numbers. You can query the DOM using the XPath expression in the Javascript developer tool console.
$x (xpath) command allows you to execute a script. The following example shows how to search $x images via the "///img'):
However, the function is also able to accept a second argument, which is about the path context, $x xpath, context. This allows us to select a detailed context (that is, an inline frame) and then query using XPath.
var frame = document.getElementsByTagName('iframe')[0].contentWindow.document.body;
$x('//'img, frame);
Query the picture in a detailed built-in frame
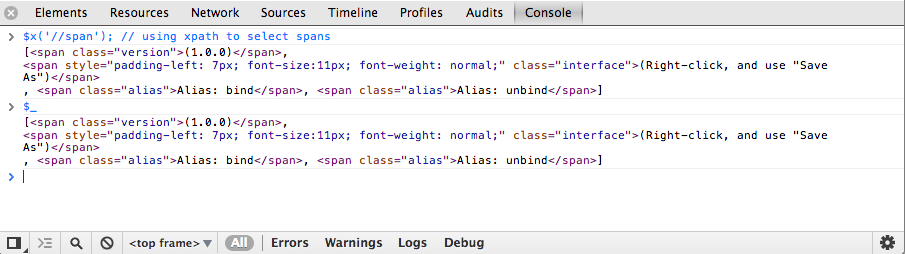
Gets the final result of the console
Using $_helper allows you to get the final results of the console. We can prove this with another example of XPath:
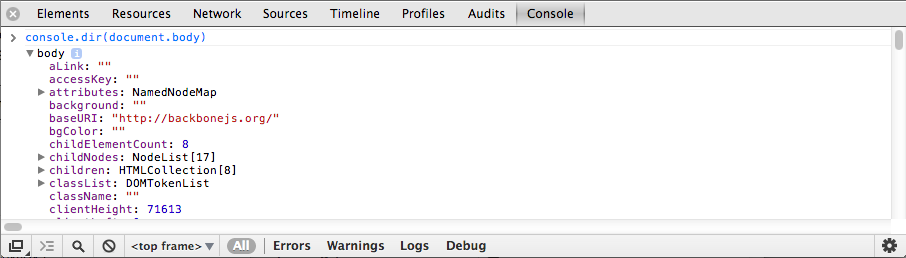
Use console.dir
The console.dir (object) command lists all the properties of all provided objects as an extensable JavaScript object. The following example shows an extensable object that represents a property under document.body.
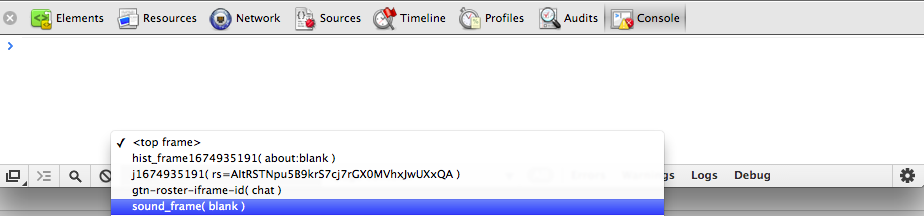
Run the JS console in a specific frame
At the bottom of the developer tool is the pull-down option, which will change depending on the context of your current label. W hen you are in the console panel, the downlier list allows you to select a frame context that the console can manipulate. Select your frame in the pull-down box and you'll find it right on the right.
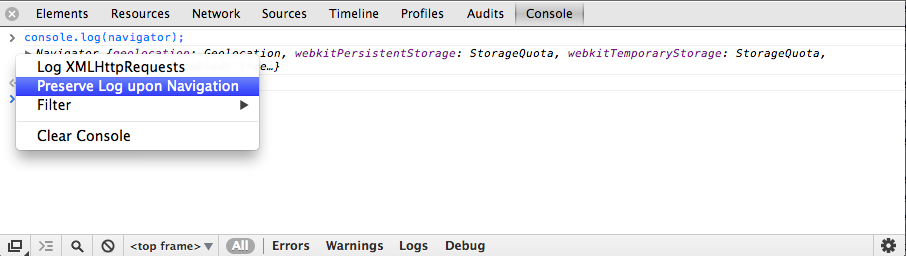
Stop cleaning the console when navigating to a new page
Sometimes when you want to jump to a new page, you want to keep the log information on the console. T o do this, just right-click in the console and select Preserve Log upon Navigation. Console history information will not be cleared when you navigate from the current page to a different page.
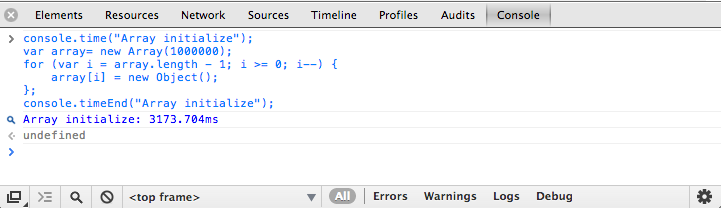
Use console.time() and console.timeEnd() for standard loops
console.time() Open a new timer with a specific label. W hen console.timeEnd() is called with the same label, the timer stops and the time between records is displayed on the console. This method is useful for measuring loops or code without calling functions:
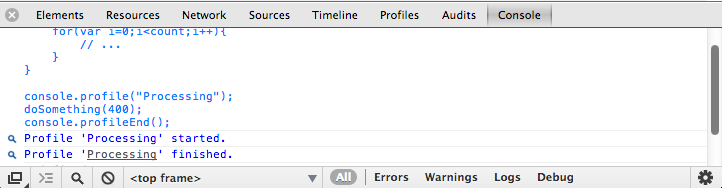
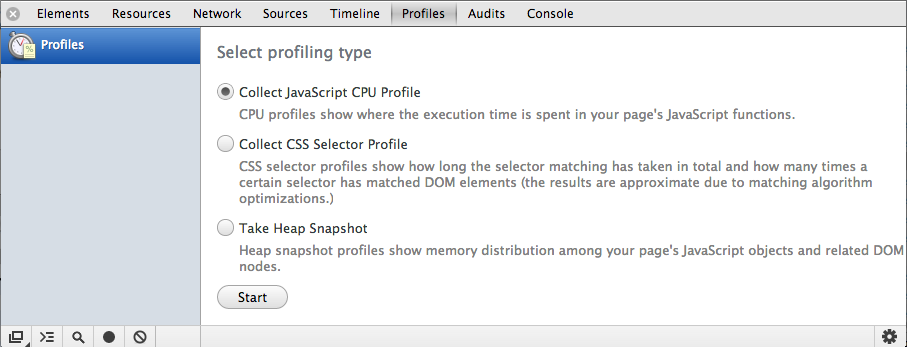
Use console.profile() and console.profileEnd() for configuration
Open the developer tool and call console.profile() to start a Javascript CPU configuration. G enerally a configuration can only mark one label, just like console below. ( "Processing") the same. To end this configuration, call console.profileEnd().
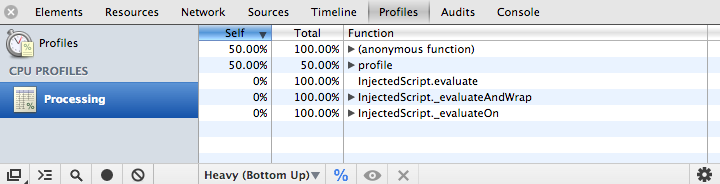
Each profile is added to the Profiles panel after it runs
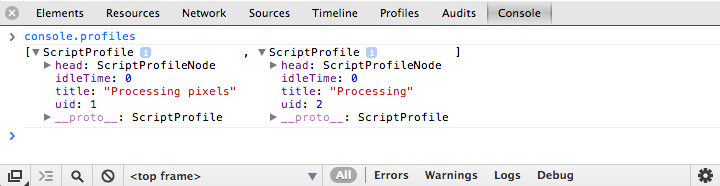
It is also added to the console.profiles array for subsequent viewing:
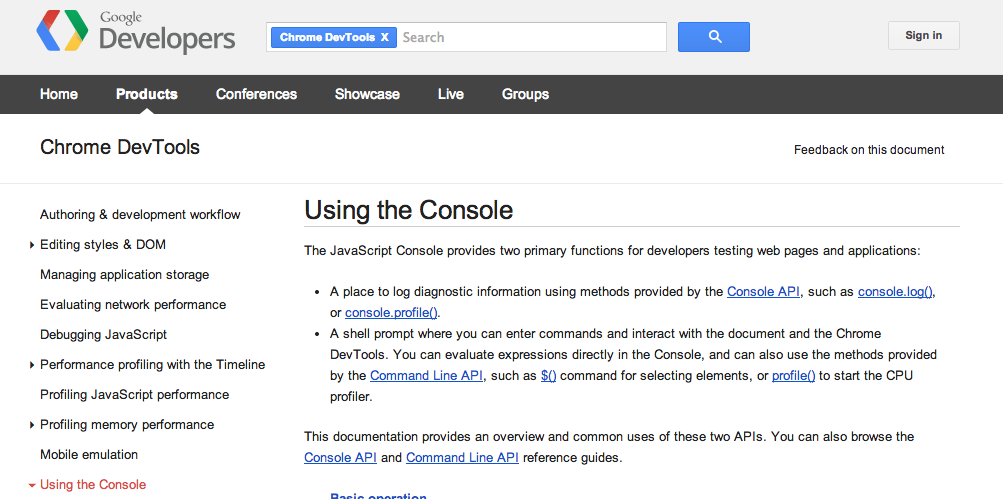
For more console tips, go to Use Console.
- Use the methods provided by the Console API to record diagnostic information about the program, such .log console() or console.profile().
- The command-line API provides methods such as selecting a $() command for an element, or turning on the profile() command for CPU configuration.
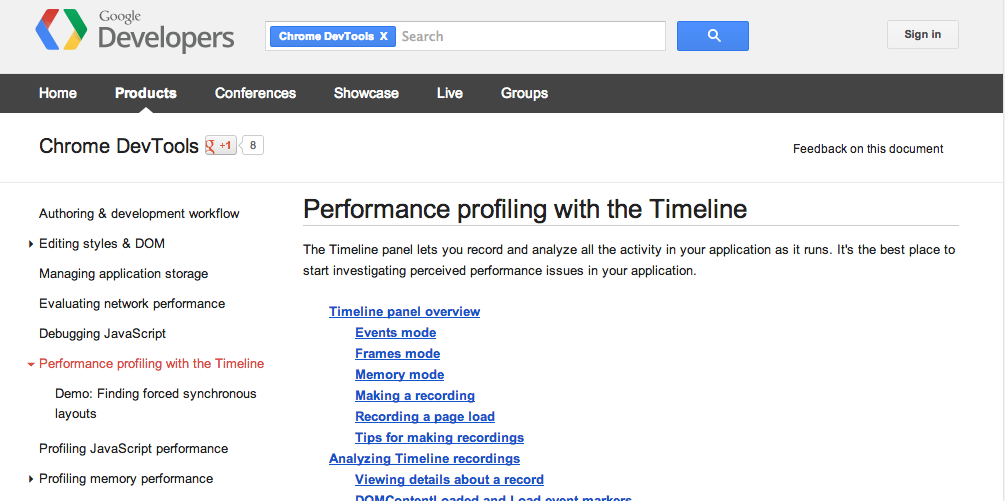
The timeline
Configure frames with timeline frame mode
The Timeline panel provides a preview of the time it takes to load your web app, such as the time it takes to get into a DOM event, the time it takes to submit a page layout, or the cost of rendering elements on the screen. It also allows you to go into three separate areas to find out why your app is slow, the three interfaces are: time, frame, and actual memory usage.
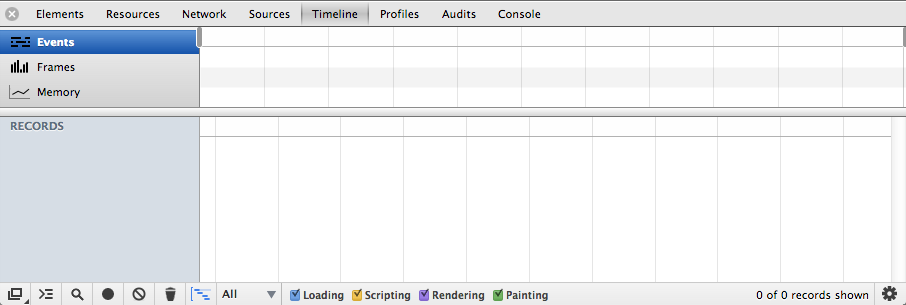
The timeline does not display any data by default. B
ut open a session record by opening
 your app and then clicking on the circle at the bottom of the window.
Or a shortcut
your app and then clicking on the circle at the bottom of the window.
Or a shortcut
E
Ctrl
or
E
also starts a recorded tag.
Cmd
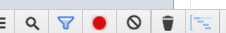
This recording button will change from gray to red and the timeline will start capturing your app. Press the button again to stop recording after completing a few actions in your app.
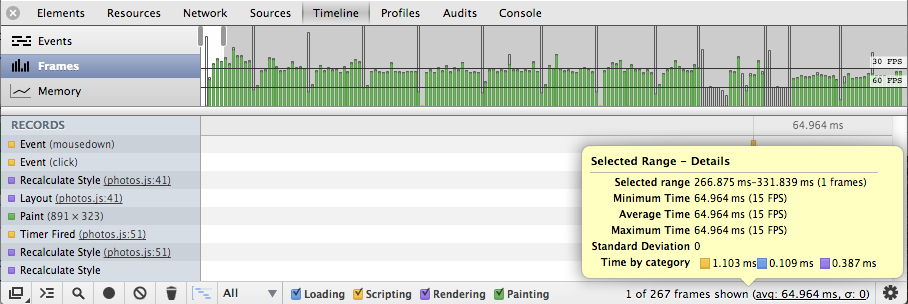
Frame mode gives you insight into ongoing tasks, and your application appears on the screen frame by frame (update). I n this mode, the vertical area ruler of the shadow corresponds to the recalculated style, composition, and so on. The transparent portion of each vertical bar represents idle time, at least on your page.
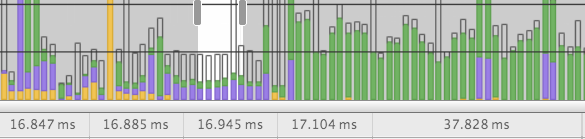
For example, your first frame takes 15 milliseconds, but it takes 30 milliseconds to execute the second frame. A common scenario is that the frame refresh rate is synchronized, so the second frame will render slightly more than 15 milliseconds. Here, frame 3 is missing the "true" hardware frame and has been submitted to the next frame, so the second frame is actually twice as long.
If your app doesn't have a lot of animation in it, and the browser needs to perform a lot of repetitive actions when executing input events, then using frames is a good idea. When you have enough time to execute such an event within a frame, your app will be more responsive and will have a good user experience.
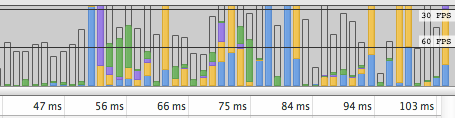
When we set it to 60 fps, we have up to 16.66 ms to do something. That's not a lot of time, so it's important to maximize the performance of your animation.
MORE: Use timeline development tools to improve performance| developer tool documentation
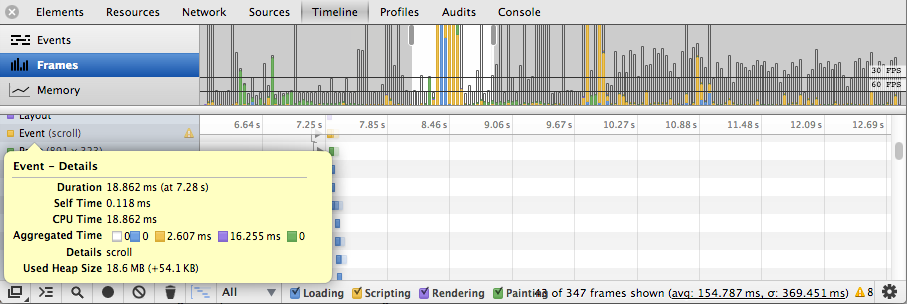
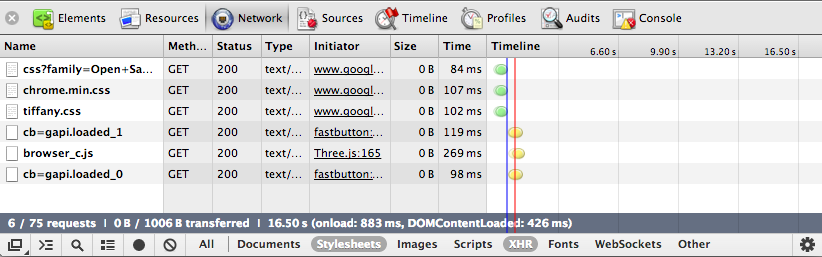
Use warnings to navigate to the specified layout event
In the timeline, if you see a yellow icon in the record view, some of your code triggers a force/sync layout event.
You want to avoid these unnecessary layout triggers because they can significantly affect the performance of your page.
MORE: Timeline warning is a taste of performance | G+
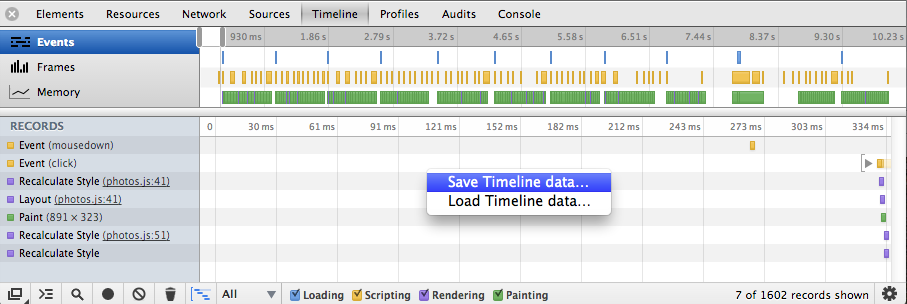
Share and analyze time axis records with others
You can browse and share the timeline with other developers, thanks to a useful import/export plug-in. S
tart/end the record with
Ctrl
or
E
Cmd
and then right-click on the timeline to select Save Timeline data.
E
The menu also supports revisiting timeline data that has already been exported.
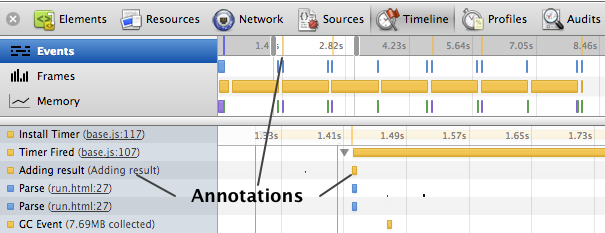
Comment on the timeline record
Use the console.timeStamp() function to annotation your timeline records. This helps you associate the code in your web with another window or browsing event.
MORE: Developer Tool Console API - Make Timeline | Developer documentation
Your app can annotate your timeline record by calling the console.timeStamp() function. T his makes it easy to bind your code to another window and browse events. I n the record below, the timeline is marked as "Add Result." Here's an example of making a timeline by using a console.
FPS counter/HUD presentation
The real-time FPS counter is a tool for viewing frame rates and dodges. The tool can be used by going to the settings menu and selecting Show FPS meter.
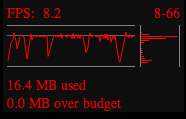
When this tool starts to work, you'll see a black box in the lower right corner, as well as frame statistics. This counter can be used in live editing to diagnose why your page dropped frames without having to switch back and forth between timeline views.
MORE: Use the drawing patterns of developer tools to analyze long-drawn events | HTML5Rocks
It's important to keep in mind that if you're just tracking the FPS counter, you might not notice the intermittent jump frame phenomenon. B e careful when using content. I t doesn't make sense if FPS works differently on the desktop than it does on the device. So be especially careful with the configuration of performance.
For more practical tips for configuring a timeline, jump to Use the timeline for a performance description:
- A place where all activity is logged and analyzed as soon as the app is running, which is the best place to start investigating your app's performance issues.
- Learn more about frame speed, the types generated in the record, and the location and layout of Chrome compute page elements and large hours.
Overview
Find
3 snapshot
with 3 snapshot technology
- Open the Developer Tool Selection Overview panel
- Do something on your page that could cause a vulnerability
- Create a new heap snapshot
- Repeat steps 2 and 3 three times
- Select the last heap snapshot
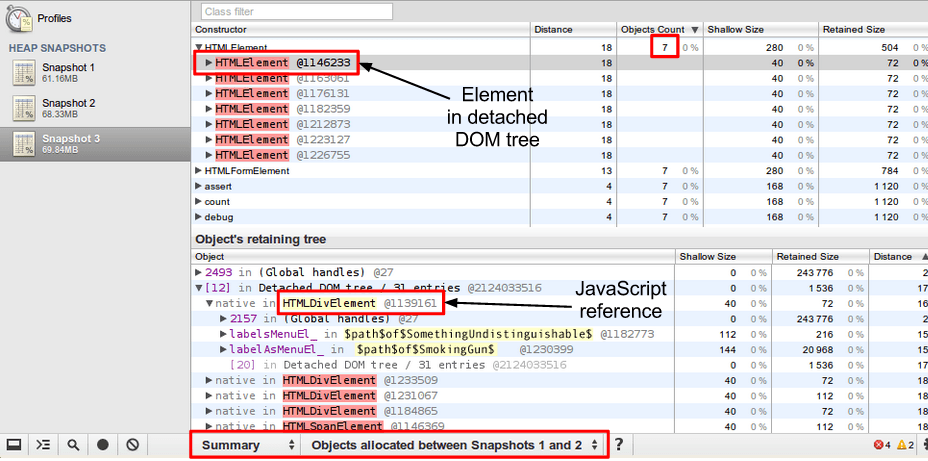
- Change the filter from All Objects to Objects between Snapshots 1 and 2
- You should now be able to see the collection of vulnerability objects. You can select one of them and view a list of its contents in the object retention tree, which helps you find the cause of the leak.
MORE: BloatBusters - Eliminate memory vulnerabilities in Gmail
Understand the nodes in heap detection
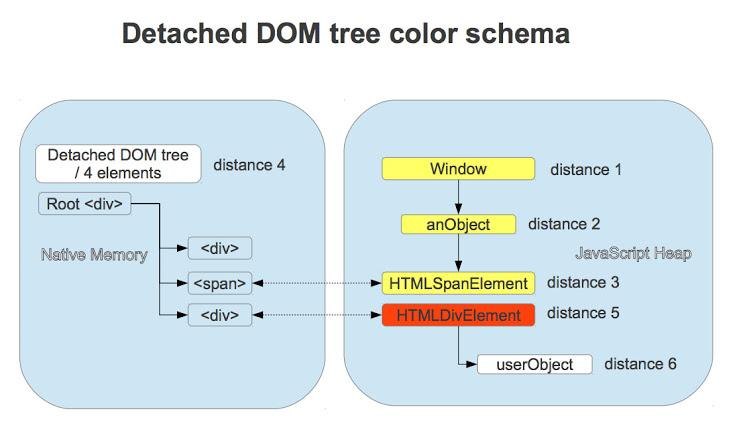
Red nodes are in the life cycle because they are part of a separate DOM tree, and one node in the tree is referenced by JavaScript (or a closed variable, some properties).
A yellow node represents a property of an object referenced from a DOM node, or an array element. There should be a series of properties from the DOM window to the element (window.foo.bar the DOM window.
More: Understanding the nodes in the heap overview | G+
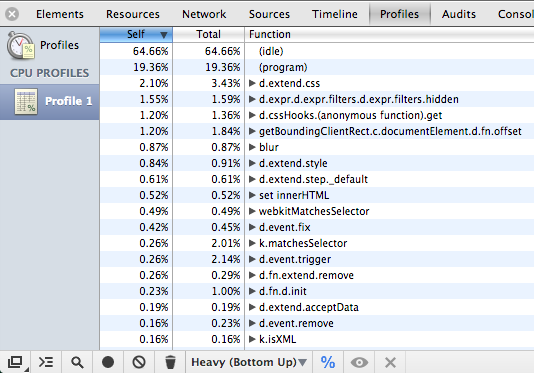
Understand the time overhead in the CPU overview
In the CPU overview, (idel), the time is currently marked. Programs that are spent in a non-browser are ("program").
Learn more about heap configuration views
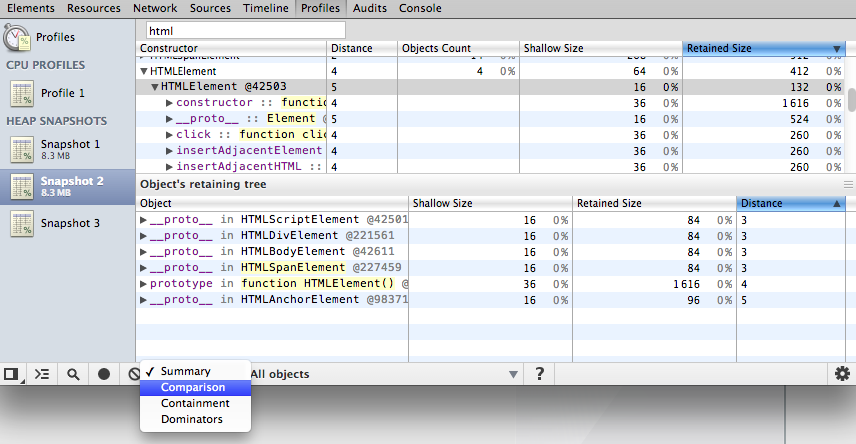
A question we often ask: What is the difference between Comparison, Dominator, Containment, and Summary views in developer tools and Profiles and Heap sanpshots. These views provide more perspective on the data in the analyzer, just as they do below:
The Comparsion view helps you track memory vulnerabilities by displaying objects that have been properly cleaned up by the garbage collector. T ypically used to compare two (or more) memory snapshots before and after an operation. This is done by checking the memory and reference counts released by the change zone to confirm the presence of the memory leak and the cause of the leak.
The Dominators view is used to confirm that references (that is, they) that should not have existed on the object when garbage collection is working properly.
Summary views help you capture objects (and their memory usage) based on grouping constructor names. This view is often useful for tracking DOM vulnerabilities.
The Containment view provides a better view of object building, which helps us analyze objects through a global namespace (that is, a window) to find out what they have always been there. It allows you to analyze program closures and drill down into your objects from the bottom.
MORE: Taming Unicorns: A Brief Analysis of JavaScript's Memory in Google Chrome
For more memory profiling tips, refer to Memory Performance Profiling :
- This article tells you how to use analytics heap memory to find memory vulnerabilities in your app
- You can drill down into the data from different views - including Summary View, Comparison View, Containment View, and Dominator View.
Source
Debug on the DOM modifier
Right-click on an element and select "Break on Subtree Modification": whenever the script passes through the elements and modifies them, the debugger runs automatically to tell you what's going on:
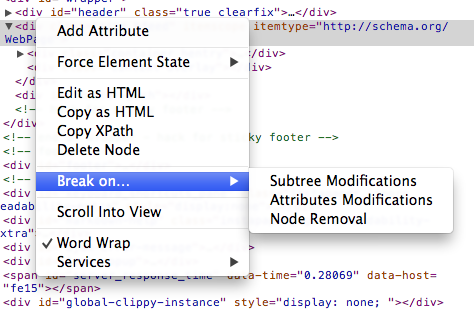
It's also worth noting that pausing modifications to inline style properties is useful for debugging DOM animations.
The trace did not catch an exception
From the Sources panel, double-clicking the pause script execution
 button interrupts code execution when an uncaught exception occurs and preserves the current state of the call stack and application - some people call it a purple pause.
Use console .log break-point activity for the system
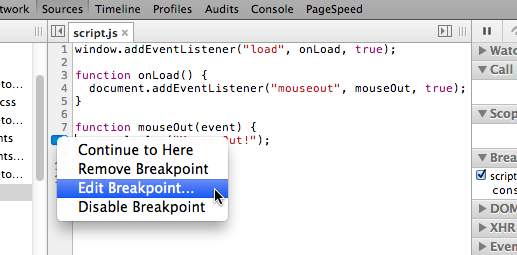
We know that developer tools support conditional break points, just by clicking on the line you want to set a break point, just like a normal set break point.
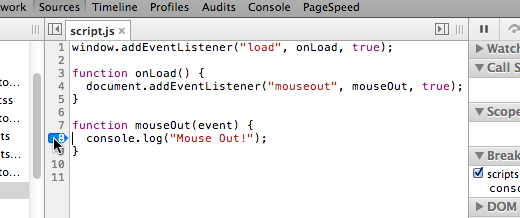
You can right-click on a line and select Edit Breakpoint, and then an expression editing area appears. Write the condition you need here (e.g. if the return value of the expression is true, the break point will stop here)
A normal expression might look like this: x s 5, but console .log is also a fully valid input.
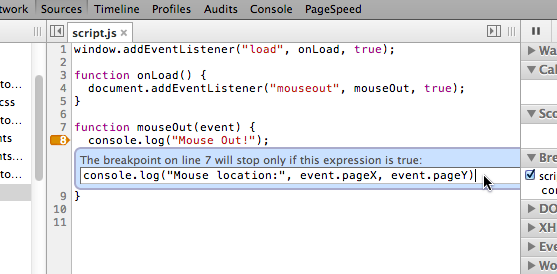
This method is very effective, and we can easily see the console that is called on the break .log statement:
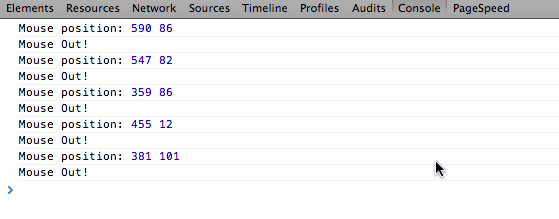
Because console .log does not have a real return value, an indeterminate conditional break point does not cause execution to be suspended and your code will continue to run. It's very much like a hard-coded console.log expression without directly modifying your code.
MORE: JavaScript Break break point activity | randomthink.net
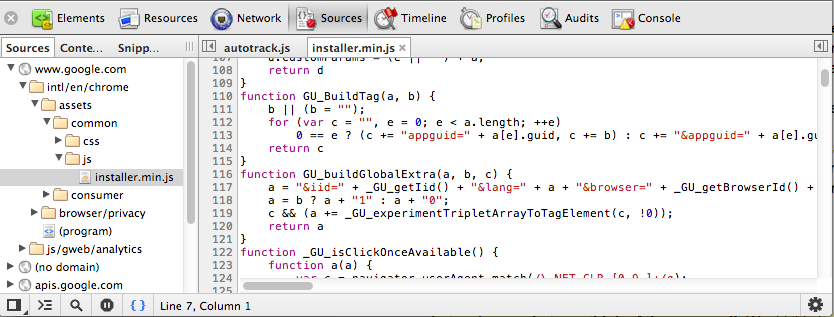
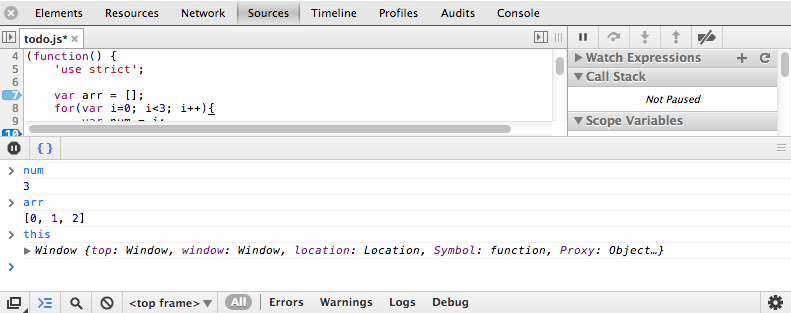
Format JavaScript
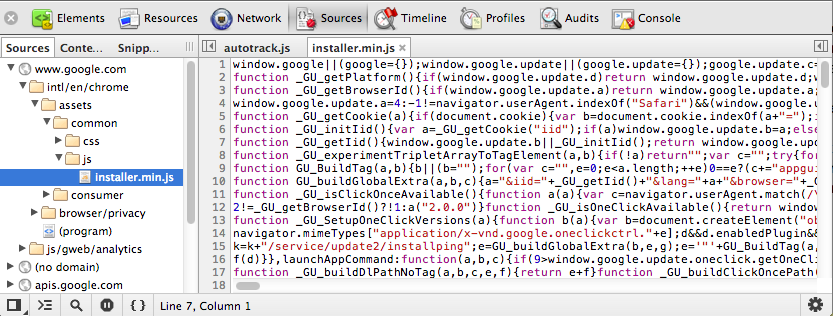
Developer tools support formatting streamlined JavaScript for reading. To format, you need to:
- Go to the Sources panel and select the script you want to format from the list of scripts.
-
Then click the format button
 at the bottom of the developer tool (marked with braces)
- Your code should have been layoutd
Before formatting:
After formatting:
Focus on the value of an expression or a variable
In a debug session, you can add a variable or expression to the Watch Expression list to avoid writing a variable or expression that you want to see more than once.
After you modify them, you can refresh or run the code directly to see what happens when you change them.
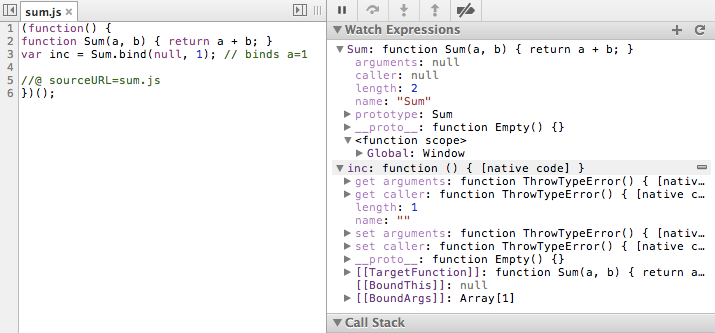
View internal properties
Suppose you set a variable with a value of
s
and do the following on it:
s.substring(1, 4) // returns 'ell'
Do
s
think s is a string? I
n fact, not necessarily. I
t can also be a wrapper for a string object.
Try the observation expression below:
"hello"
Object("hello")
The first is a string constant, and the second is a complete object. C onfusingly, the two values are almost identical. But the second one has a real property that you can set yourself.
Expand the list of properties and you'll notice why it's not a complete object: it will have an in-house property, the PrimitiveValue, which stores the original value of the string. You can't access this property through your code, but you can now view it through the debug tools of the developer tool.
MORE: Learn Javascript concepts with developer tools | GitHub
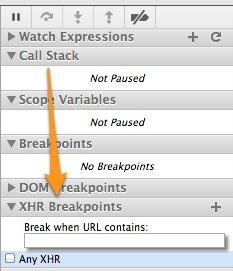
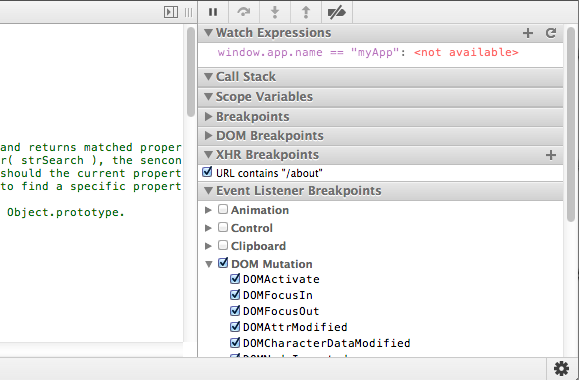
Simplify debugging XHRs
Open the "XHR Break break point" option from the debugger, and when you start an XHR request, you can specify that your code jump into any URL (or even a substring). Even tell it to load every XHR when interrupted.
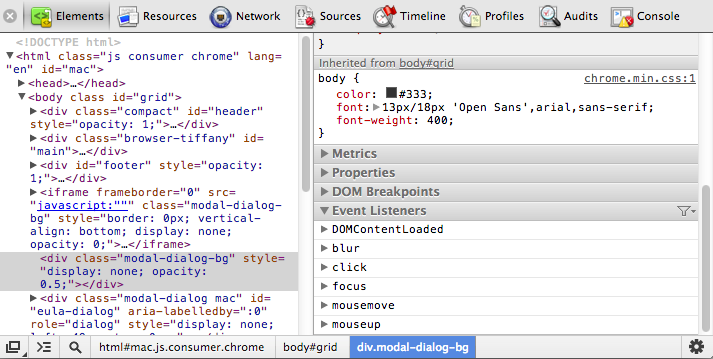
Unregister the event processor on the element
With the "Element" tab open, find the elements in the DOM tree and click the node you want to select. Note: You can also do this by using targetNode, the getEventListener in the console API.
On the right, click expand the Event Listeners option. There you will find a list of all event listening registered on the element.
The Esc key displays the console
When debugging in the Sources panel, you sometimes want to go into the console at the same time. At this point you just need to click the escape key to open the console.
You can write JavaScript execution from this console to see what's expected, but a better place is that if you pause at the beginning of a break point, the JS that has already been executed will be in the context of the current pause.
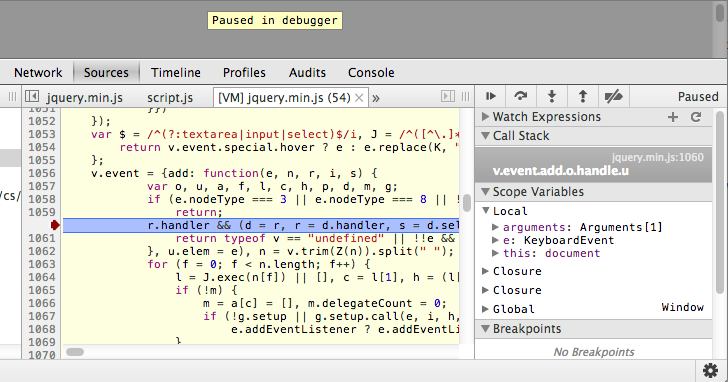
Improves efficiency when paused at break points
When your script pauses at a break point, there are some useful parameters for you to use.
You may know that you control code execution through "Continue," "Step Over," "Step Into," and "Step Out," but these buttons all have keyboard shortcuts. Learning these will make you more efficient in navigating your code.
The observation expression (to the right of the sidebar) will monitor the expression, so you don't have to always jump back to the console (for example, X.Y). The call stack shows function calls that were experienced from the time the system started running all the way to the current location.
At Scope Variables, you can right-click on any function and then use "Jump to definition" to get inside the script that defines the function.
The DOM break point shows any changes made using "Break on" when right-clicking a node in the element panel. This is helpful for debugging listeners to be properly added to nodes and what happens when they are called.
The XHR break point panel is also useful because it sets break points for XMLHttpRequests. Specify the break point by entering a URL substring that you want to view.
Pause in an exception
You might want to pause JavaScript execution when you throw an exception and check the call stack, range variables, and the state of your application.
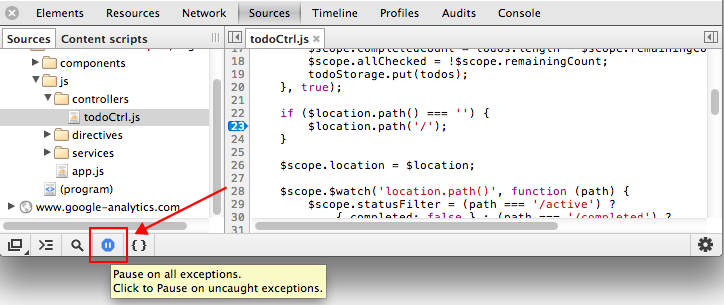
At the top of the
 script panel there is a pause button that lets you select different exception handling modes.
You may not
script panel there is a pause button that lets you select different exception handling modes.
You may not
 want to pause all exceptions unless the code you are debugging is wrapped in try/catch.
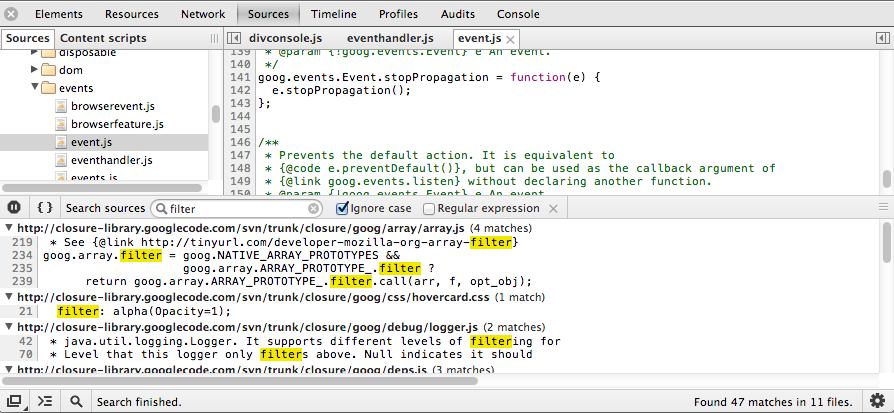
Search on all script text
If you want to find a specified string in all the files loaded on a page, you can call the search panel with the following shortcuts:
-
Ctr+Shift+F(Windows,Linux) -
Cmd+Opt+F(Mac OSX)
This search supports both regular expressions and case sensitive.
Debug CoffeeScript with developer tools and source mapping
Source mapping provides a language-independent way to map compiled engineering code to source code written in your original development environment.
When analyzing product code, the code is usually scaled down (in case a language is translated into compiled JavaScript), which makes it difficult to find which line of code is mapped to your original code.
During the compilation phase, the source map can save this information to allow you to debug the product code and return the line number in your original file to you. This makes the whole world different because you can read the product code and debug it at the same time, whether it's in CoffeeScript or some other location - as long as it has a source map, you can easily debug it.
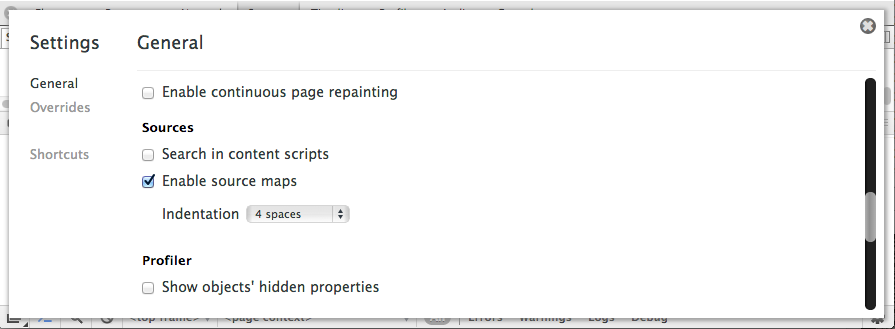
To enable source mapping in Chrome:
- Open Setting cog and General
- Select Enable source maps
Below:
- To compile your CoffeeScript into JavaScript, execute this command: coffee -c myexample.coffee
- Install CoffeeScript Redux
- Create a source mapping file, example.js.map, which should hold the mapping information: $coffee-redux/bin/coffee--source-map-i-example.coffee .js.map
- Make sure that the resulting JavaScript file, the example .js, already has a url mapped to the source file on the last line, as this is: // s sourceMappingURL s .js.map
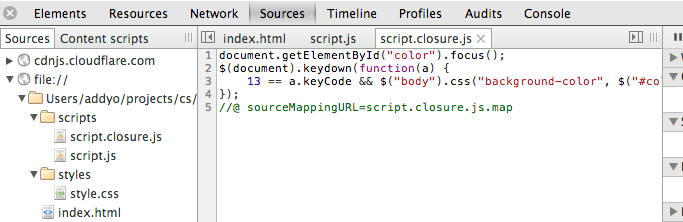
When you start debugging your CoffeeScript code, you should be thankful for this statement, which lets developer tools know where your source files are.
You can then use this source mapping to reference the first source map (CS to JS) using a tool similar to UglifyJS2 during your optimization/shrinking phase and return the simplified JavaScript file it maps to CoffeeScript instead of passing it directly to the compiled JavaScript output location. This allows you to debug the product code directly, and the changes are returned directly to the CoffeeScript source code.
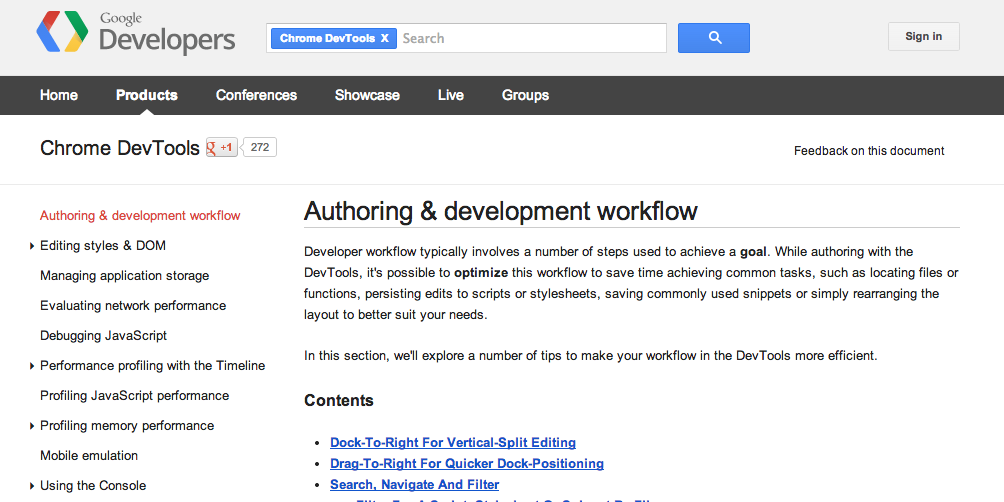
For more useful authoring workflow tips, go to Authoring and development workflows :
- Here you can learn how to optimize your development workflow to save time on general operations, such as locating a file or a function, continuously editing scripts or style sheets, and simplifying the process of adjusting layout.
- Learn about new features, such as Snippet, which can be used to save and execute specific JavaScripts fragments built into development tools.
Elements
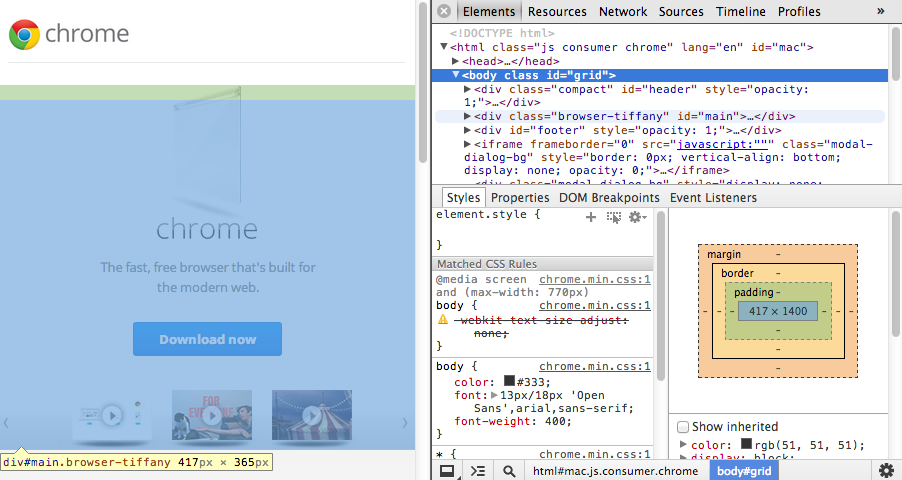
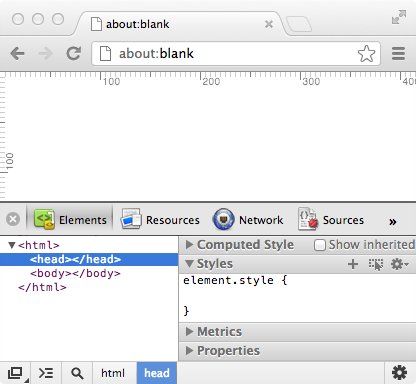
Enable the ruler
You can enable a ruler under Settings and General and Show rulers, which appears when you hover over an element or select an element.
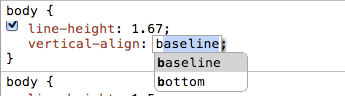
The automatic completion of the CSS property
Developer tools support the automatic completion of CSS properties and values, including those that require a prefix, which is helpful in deciding what properties to set for the current element.
Suggestions pop up when you start outputing a name for a property or value, and you can also use the right-click to scroll through the list of available properties. Be aware that the selected option is applied directly to the page style sheet so its effect is directly available.
In the style panel, you can define colors using named fields such as "red", HSL, HEX, or RGB values. If needed, you can hold down the shift/mouse click to iterate between these values.
If you want to show all the supported properties,
Ctrl
space
to present a list of suggestions.
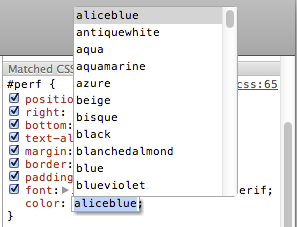
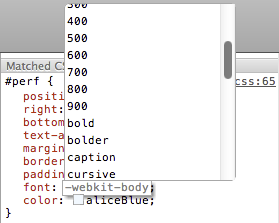
Suggested lists are numbers that are relevant to specific content and can also be displayed under certain circumstances (for example, when targeting fonts), and values that have been named or prefixed can also be displayed.
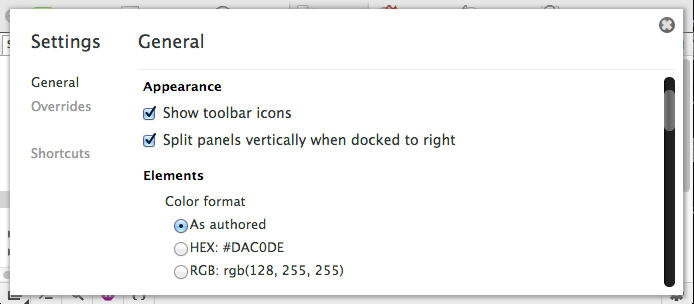
Color selectors in developer tools
The developer tool includes a built-in color selector that appears when you click on a preview block of any valid color.
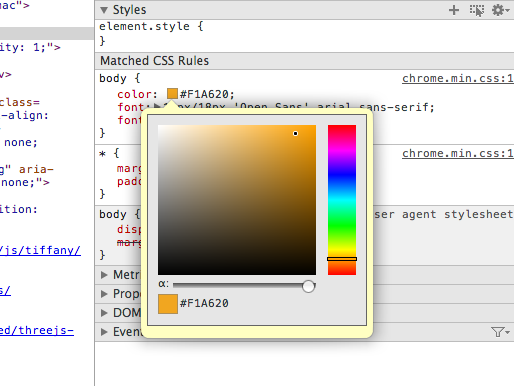
You
Shift
the format of the selected color by clicking Shift .
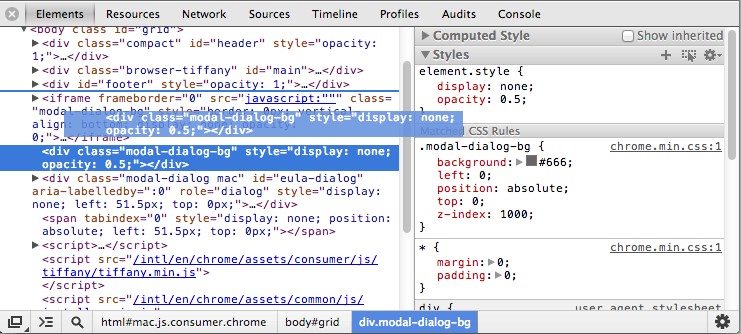
Add a new CSS style
You can add a new CSS property anywhere you click within the code block of the CSS rule, including "element.style," and the property is immediately applied to the current page.
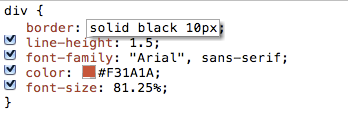
Once you have successfully added a property, you can press tab to set the next property.
Click
 the button and the new selector will be added to the Style sub-panel on the right.
This defines a selector, and you can add new properties and values in this way.
the button and the new selector will be added to the Style sub-panel on the right.
This defines a selector, and you can add new properties and values in this way.
Note: You can also edit any selector in the Style panel by clicking the name of a selector. Once the name changes, properties that already exist in the selector are added to the elements defined by the new selector.
The new pseudo-class selectors can be added in a similar way, after adding them to the selector's name.
It is also important to note that when you
 click the "Toggle element states" button next to the New Selector button, you will be converted to the "Force element state" panel.
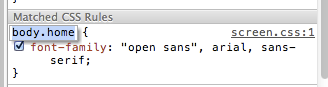
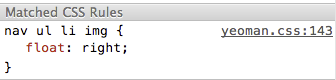
Back in the Matched CSS Rules panel, clicking on the link to the style sheet after the rule will take you to the Sources panel. The full style sheet definition is displayed in the panel and jumps to the row where the rule is located.
Drag in the element panel
In the element panel, you can drag an element to change its position in the parent class, or move it to a completely different place in the document.
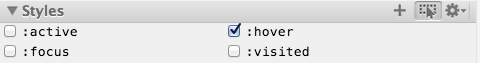
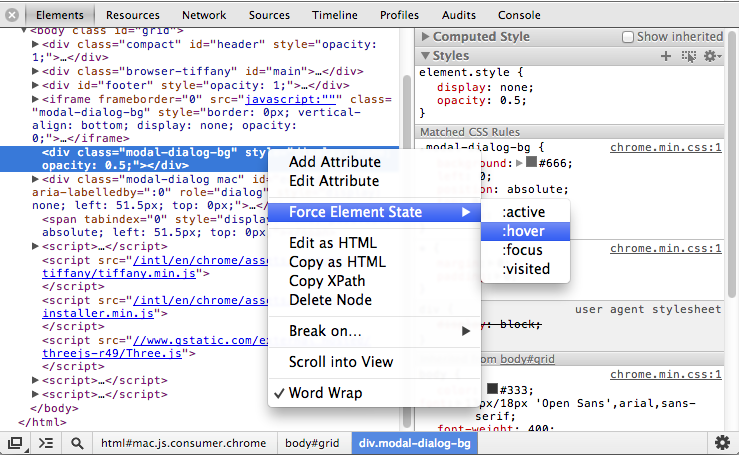
Force element state
Want to force an element to fit into a particular state?
- Right-click a child element and select "Inspect Element"
- Right-click its parent element in the element panel and select Force Element State
- You can choose one of them: active,:hover,:focus,:visited to force entry into one of these states.
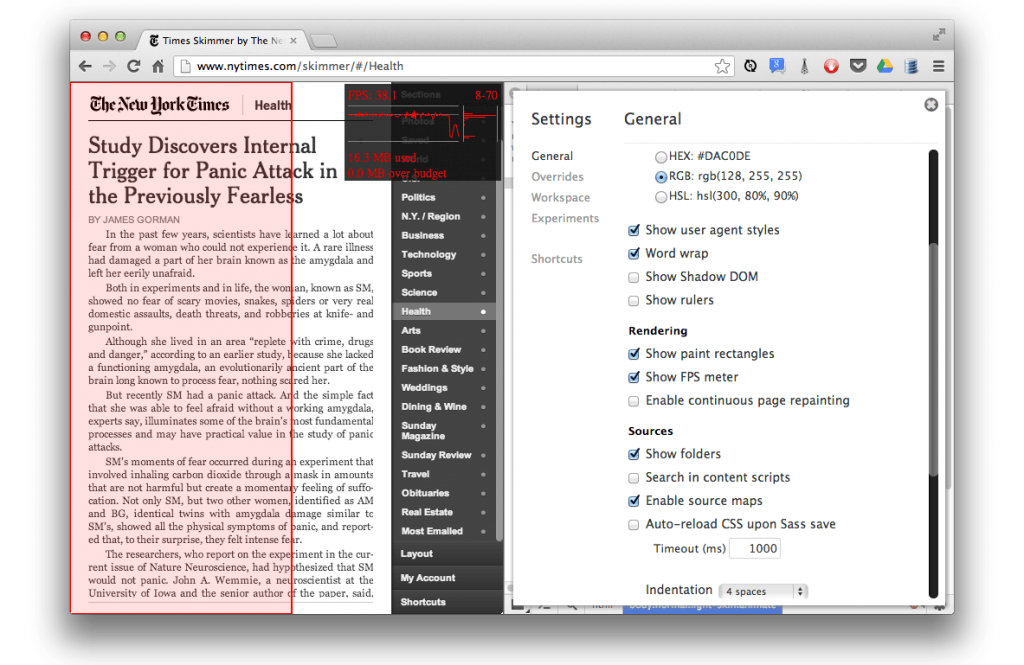
Write and debug Sass with developer tools
Note: To write Sass in Chrome, you must have a 3.3.0 (preview) version of the Sass compiler, which is now the only version that supports source mapping.
Adjusting a file with a precompiled CSS style can be a challenge because changes to the CSS style in the development tool are not returned to the Sass source file. This means that when you make changes, if you want them to take effect, you must return to the source file and make the changes manually through an external editor.
Recent improvements to the Sass development workflow have made it no longer a problem. To get Sass support:
- Make sure you have experience with developer tools using out:flags
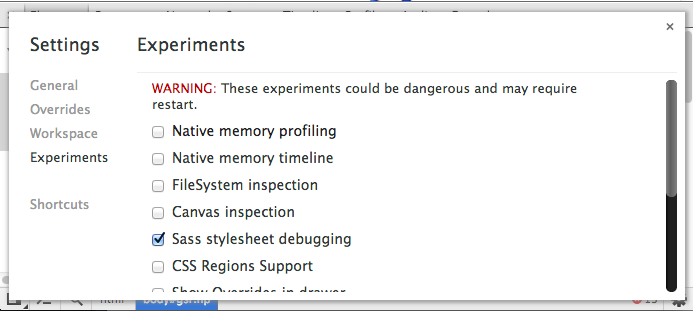
-
Next, go to Set cog and Experiment and enable "Sass stylesheet debugging" (note that this feature will soon end the experiment phase)
-
Go to General menu and Sets and Check to select "Enable source maps" and "Auto-reload CSS upon Sass Save".
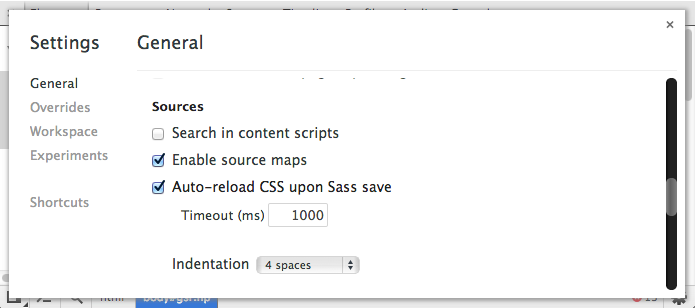 You can time out as the default. D
epending on how long the Sass compiler takes to compile, you may need to adjust this autoload delay.
If necessary, you can also invalidate the automatic reload and manually refresh the page between them.
You can time out as the default. D
epending on how long the Sass compiler takes to compile, you may need to adjust this autoload delay.
If necessary, you can also invalidate the automatic reload and manually refresh the page between them.
- Navigate to the engineering page where you want to debug Sass on Chrome (opened with developer tools)
-
Next, turn on the Sass compiler (you can also specify a target CSS compiler) by using the following indicator:
sass--watch--sourcemap sass/styles.scss:styles.css.
T
his will allow Sass to observe your changes to the Sass source file and then create the source mapping file (.map) for each generated CSS file.
Next, you see something like
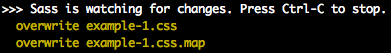 it's in the console: It proves that the Sass debugger is really working
-
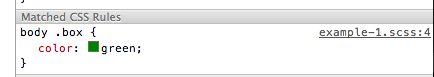
If you start working as expected, you can go to the Element panel.
First you'll notice that the file name of your style now shows the appropriate .scss source file, and the corresponding line number in the source file is displayed.
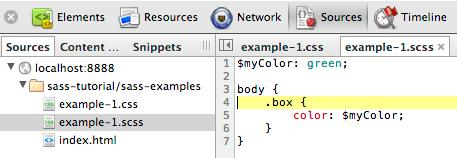
-
Clicking on the file name here will go directly to the Sources panel and highlight the line where the selector is located.
Now you're ready to adjust the Sass source file within the development tool, and the built-in editor supports syntax highlighting.
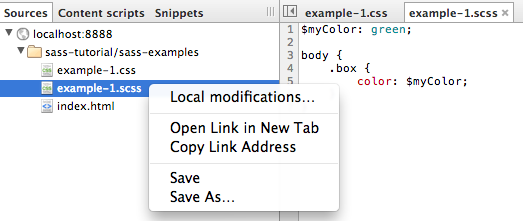
-
If you want to edit a Sass file in the Source panel, the first thing you need to make sure is that the development tool knows where the file exists on the local file system. R
ight-click in the editor, and then select Save As to override the original file with the file you are currently editing.
Since autoloading is turned on and Sass is already running in the background, the changes we make will appear immediately in Chrome and the Developer Editor.
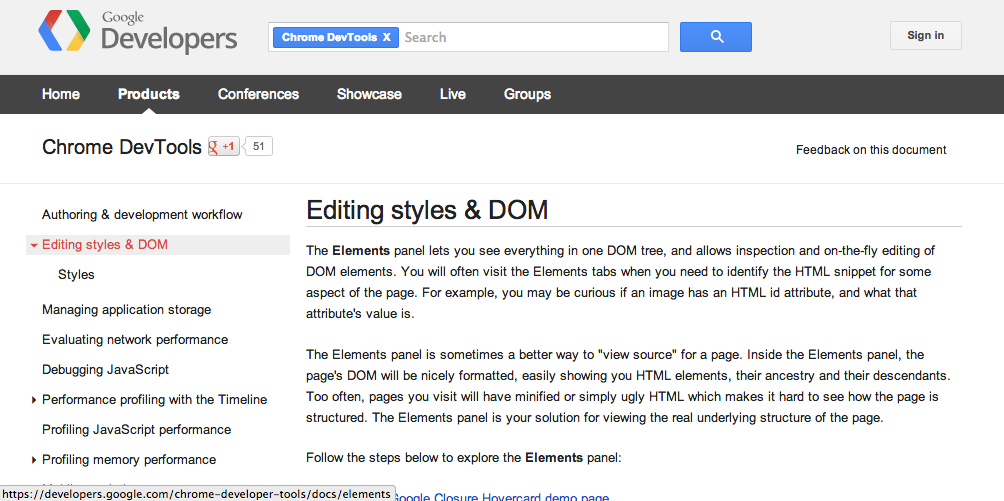
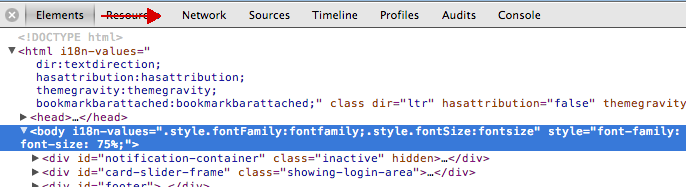
For more tips on using elements and styles, go to Edit Styles and Dom
- Here you can learn how to view the actual structure of the page. For example, you might be curious about whether a picture has an HTML id property and want to know what the value of that property is.
- Learn how to observe every message in the DOM tree, including checking and quickly editing DOM elements. If you need to confirm an HTML fragment of a part of a page, you may frequently access the Element tab.
Internet
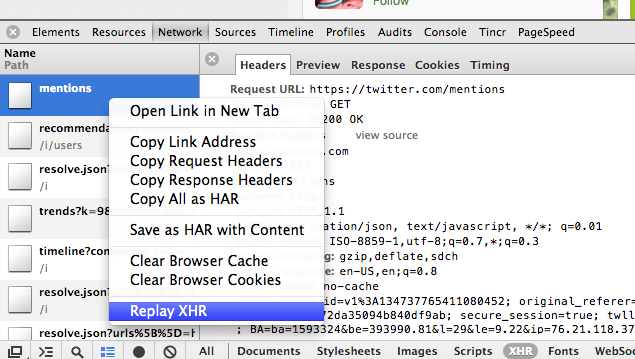
Re-issue the XHRs request
As you may know, the web panel shows all the requests on your page, including XHRs. Right-clicking on the request displays the context menu, and then select "Replay XHR" to re-issue the XHRs request (POST or GET)
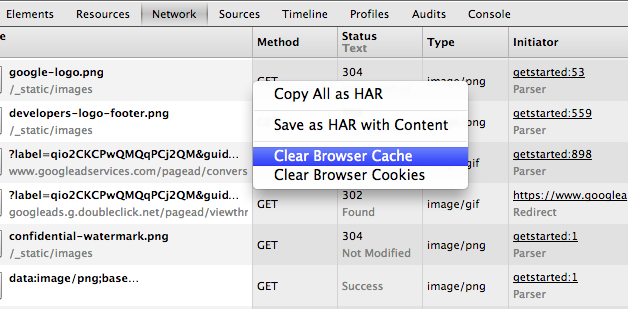
Clear network cache and cookies
On anywhere in the network panel, right click / Press and hold
Ctrl
Keep, click the menu, select Clear Browser Cache / Network Cache in the menu.
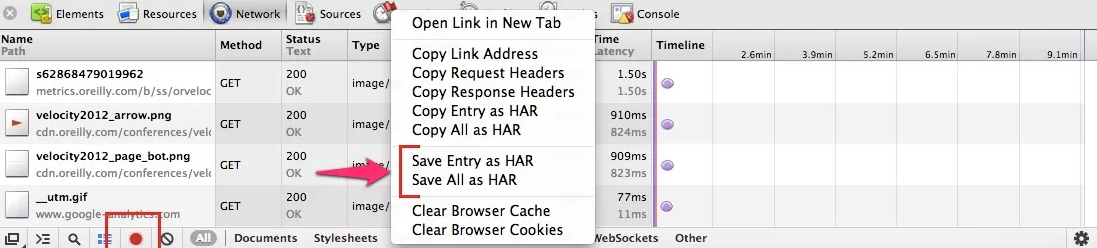
Record a tracking stack & export Waterfall
- Click "RECORD" to capture a multi-page trace
- To export Meta-Data request: Right click and select "Copy Entry As Har"
- To export all Waterfall: Right click and select "Copy All As Har"
More: Wait, what can developer tools do?Igvita.com
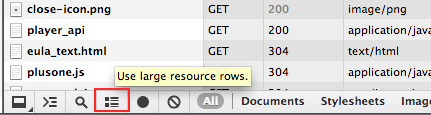
Use the Large Resource Rows on the Network Timeling View More Details
You can display additional information in the Campact / Smaller Resource Rows view by launching the "Use Large Resource Rows" icon at the bottom of the network panel.
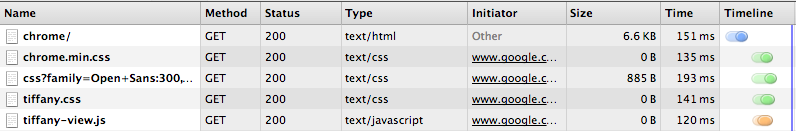
Contrast Smaller Resource Rows View:
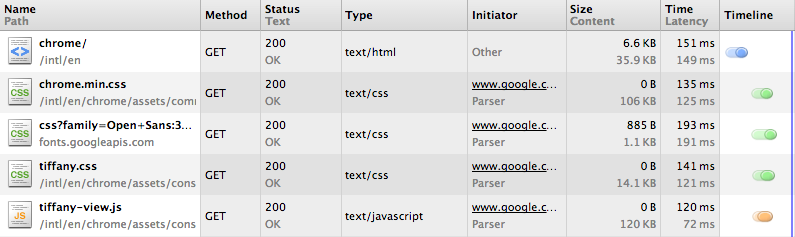
And the situation of Larger Row:
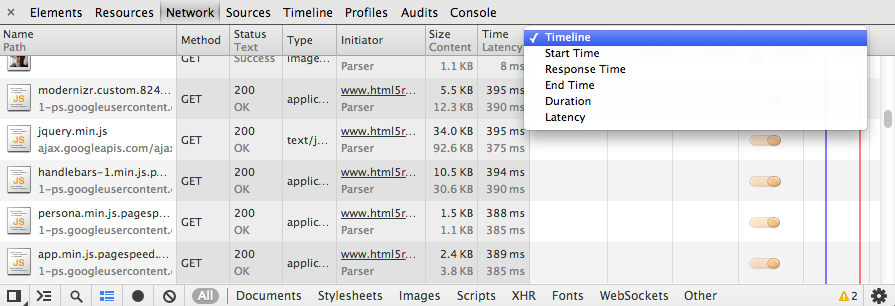
Get more information on the network panel
Left button The head of the time axis in the network panel can access the details of more network requests.You can choose one in the following selections:
-
Timeline
-
Starting time
-
Response time
-
End Time
-
duration
- waiting time
Browse the gray text to deepen:
-
What is the HTTP network definition of each request?
-
When is the first byte requesting the first byte?
-
What is the slowest resource in response time?
- What is the shortest supply of duration?
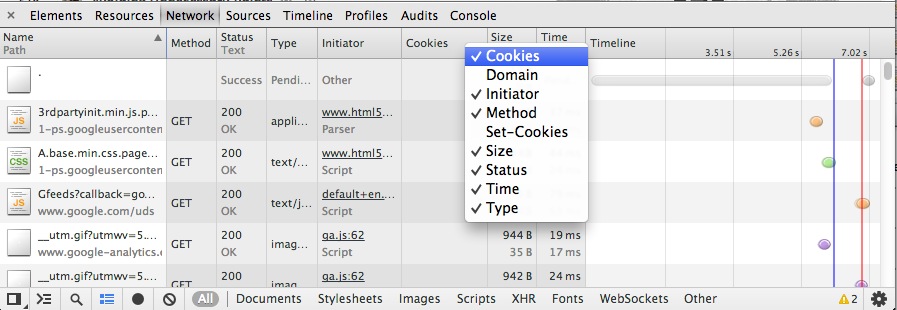
Head of any line in the network panel Right key You can enable or disable columns.There is no display by default, there is no display:
-
Coolies
-
Domain
- Set-Cookies
WebSocket check
In the network panel, you can use the filter of the bottom window to view the WebSocket information frame.

For example: enter Echo In the example, the "Websocket" filter is selected at the bottom of the network panel and then click the "Connect" button.Any information you sent through the "Send" button can be observed with the "Frames" sub-panel.
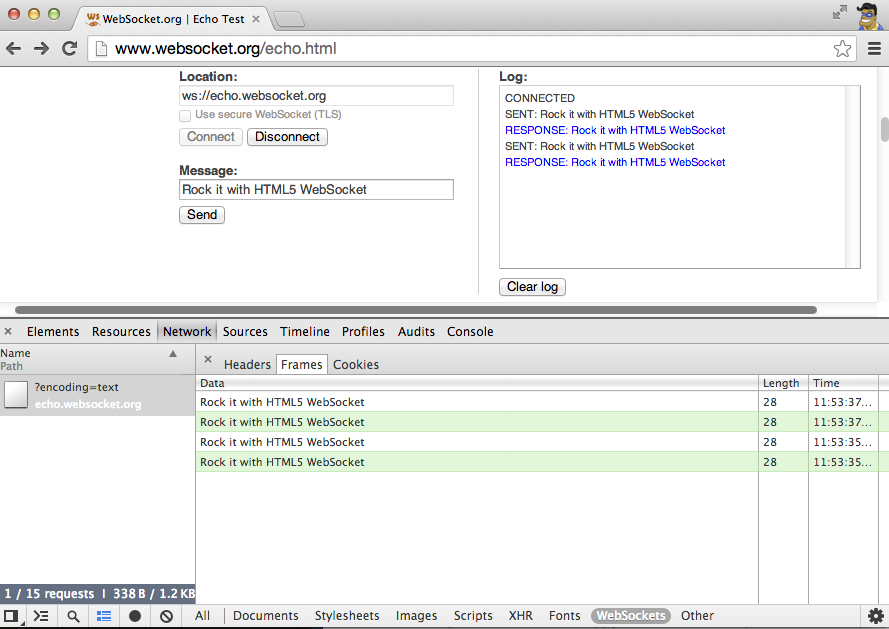
Green means information from your client.WebSocket observes very valid, which allows you to view WebSocket's stand-alone frames while observing WebSocket Handshake.
More: Wait, what can developer tools do?Igvita.com
More: Use Developer Tools WebSocket | kaazing
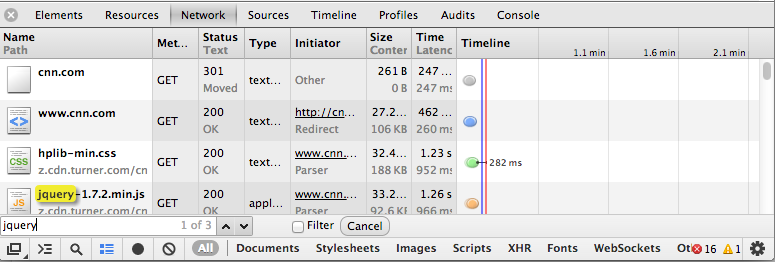
Find and filter XHRS in the network panel
When you observe the network request in the network panel, you can narrow down the lookup range through the special key on the keyboard.use
Ctrl
+
F
or
Cmd
+
F
It can make the whole process easier.
In the search input box, enter the keyword you want to search, and the filename / URL in the request is highlighted.The results are displayed, you can use the up and down button next to the input box to select the one you need.
Although this is useful, it will be more useful if it can only display options that match the keywords you searched.The "Filter" option can do this, please see example:
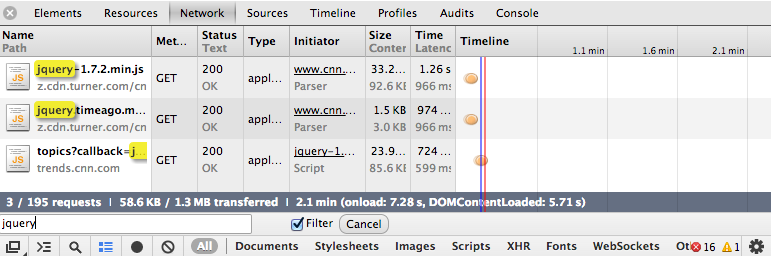
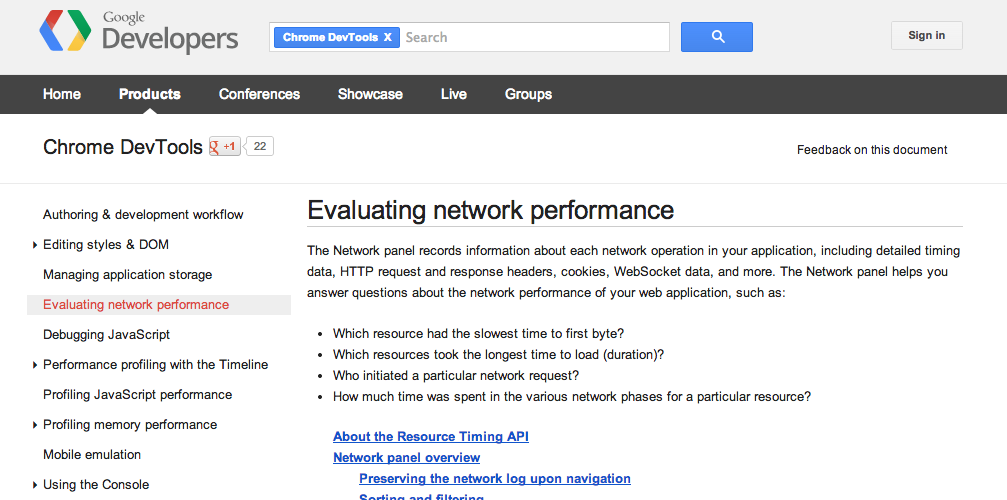
More: Evaluate Network Performance | Developer Tools Documentation
Get internal state of network stack
The "About: Net-INTERNALS" page is a special URL that stores a temporary view of the internal state of the network stack.This is very helpful for debugging performance and connection issues.This includes information, proxy settings, and DNS cache as request performance.
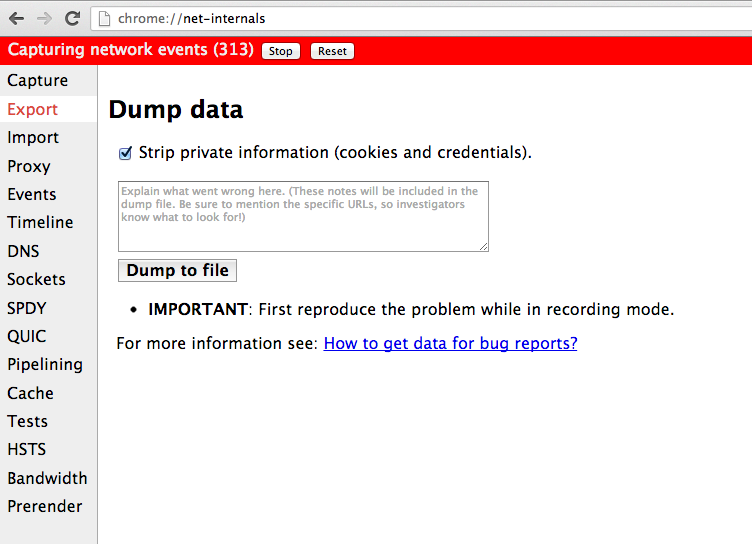
It is also necessary to note that about: Net-Internals / # Tests is to test a special URL.
More skills to calculate network performance, please go Assess network performance
- Here you can learn how to view the network option in your application.Includes time data details, HTTP requests and corresponding heads, cookies, WebSocket data, and more.
- Which resource is the slower when you start loading?Which resource takes up the longest load time (duration)?Who opened a network request?and many more.
set up
Imitation touch event
Touch is an input method that is difficult to test on your computer because touch input is not supported on most desktops.Testing on the mobile terminal will extend your development cycle, once you make a change, you need to upload to the server and switch to the device.
A solution to this problem is to simulate a touch event on your development machine.For single touch, Chrome Developer Tools support a single Touch event Simulation, which makes it easier to debug mobile applications on your computer.
To turn on touch simulation:
- Open the Overrides menu in the developer tool
- Scroll and select "Enable Touch Events"
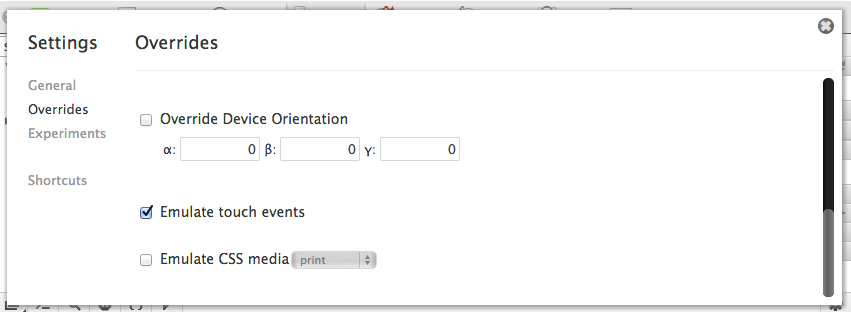
Now we can debug touch events as standard desktop events, or set event monitor breakpoints in the source panel.
More: Developer Tools Equipment Mode | DevTools Documentation
Simulated UA String & Device View
Typically start a sample on the desktop then handling the specific mobile device part on the device you want to support, it is easier, the device simulator can help us make this process easier.
Developer Tools Support Equipment, including local User Agent, and heavy load in size.This allows developers to debug the display effect of the mobile terminal on different devices and operating systems.
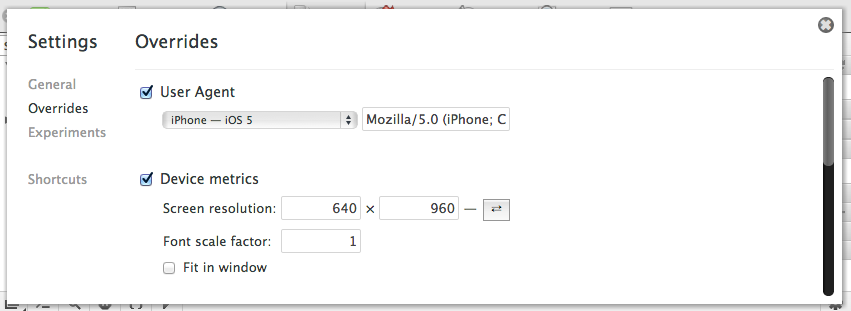
Now you can simulate the size of the exact device, such as Galaxy Nexus, and iPhone, etc. to test your query driver design.
More: Equipment Mode of Developer Tools | Developer Tools Documents
Simulated geographic information
In a HTML5 application supported by the geographic information, it is very useful to debug the output of different latles.
The developer tool supports location information to override Navigator.geLocation, or simulates an analog location.
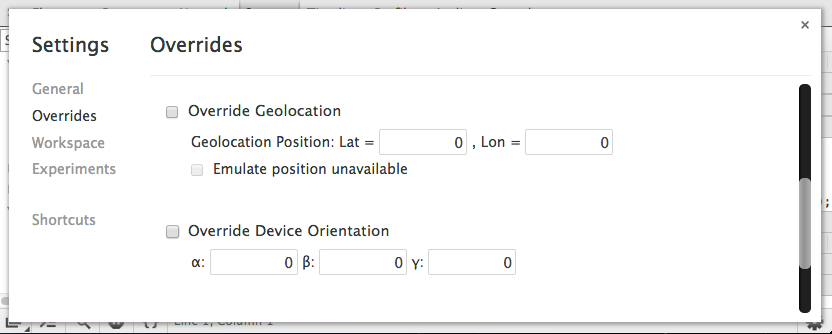
Rewriting the location
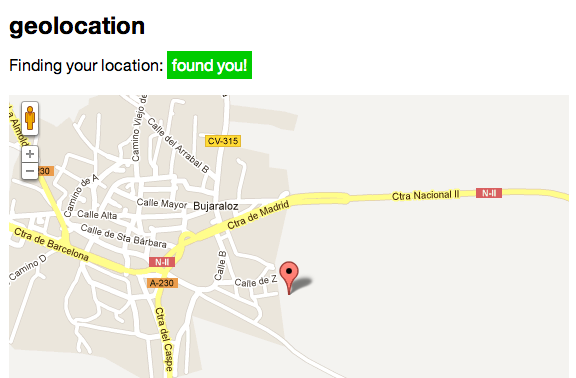
- Enter Geographic information Examples.
- Allow the page to use your location.This will get an accurate position.
- Open the overwritten menu in the developer tool.
- Check "Override Geology" and enter LAT = 41.4949819, LAT = -0.1461206.
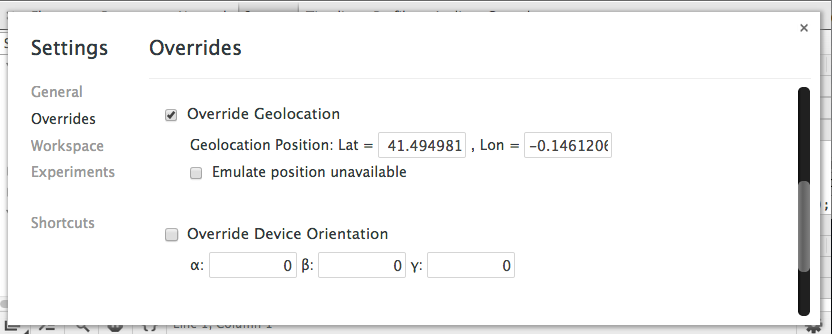
- refresh page.This example uses the location information you rewritten to locate.
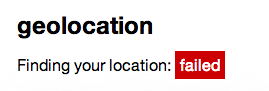
- Now select the "Emulate Position Unavailable" option.
- refresh page.The page will prompt you to find your location information failed.
More: Developer Tool Simulation Mobile Devices | DevTools Docs
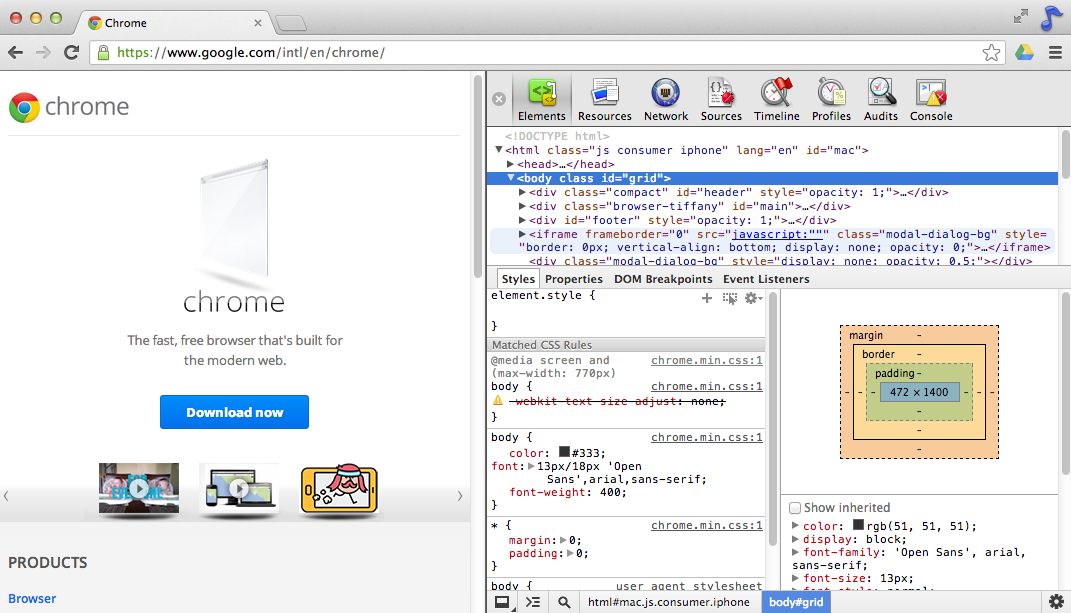
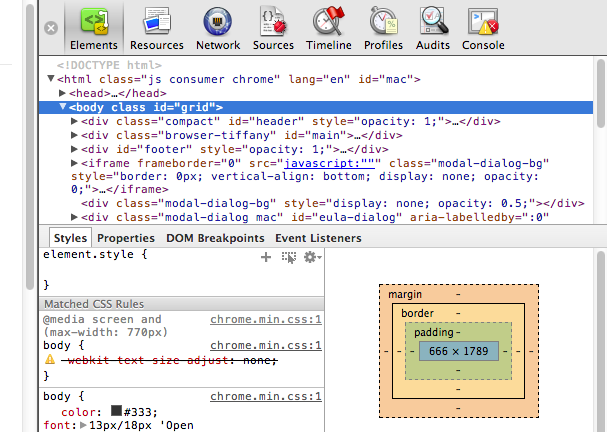
Dock-to-right view debugging
Dock-to-Right mode is also helpful for previewing your page in a narrowed view.To use this:
-
Layout selector icon at the bottom of the developer tool window
 To open Dock-to-Right mode.
- You can now drag the window distributor and drag the left and right to change the width of the view, and then trigger your media query breakpoint.
Let JavaScript fail
Click the set gear in the lower right corner, then "Disable JavaScript" is enabled in Setting> General.When the developer tool has been opened and this option is also selected, then the current page JavaScript script will fail.
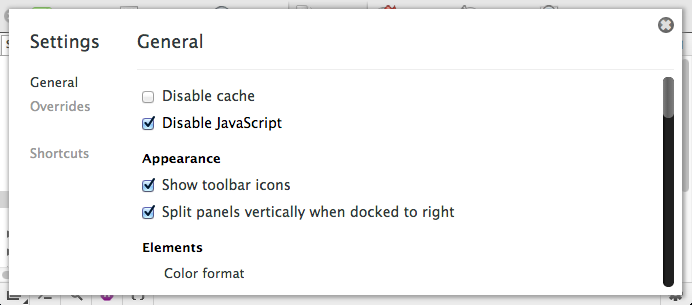
If this feature is desired, the same can also start Chrome via the "-disable-javascript" command.
Universal
Quickly switch in the label
Cmd
+
]
with
Cmd
+
[
(or
Ctrl
+
]
with
Ctrl
+
[
The shortcut is allowed to easily switch between the developer tools.Use them to avoid manual selection labels.
Try improved Dock-to-Right
Improved element panels and source panels are horizontally separated, and as long as you open the Dock-to-Right mode, you can experience this feature in the Chrome beta:
However, if you already have a very wide screen and don't want to use this screen, you only need to select the "split panels value when you docked to Right" option in the setup panel.
More: 3 Steps Get a better Dock-to-Right experience | G +
use
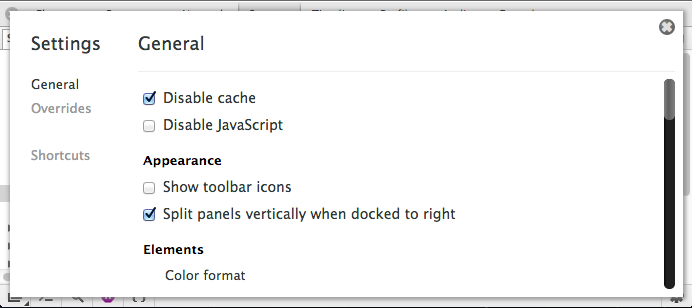
Disable Cache
Let the cache fail
You can enable it under the set gear
Disable cache
Options to make disk cache invalid.This is huge for development, but developer tools must be visible and open to implement this feature.
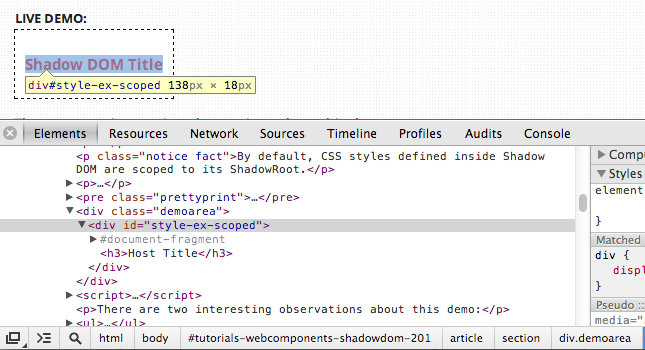
Check Shadow Dom
Elements containing Shadow DOM do not display in the element tag.
-
Make
Show Shadow DOMThe check box takes effect. - Restart the developer tool
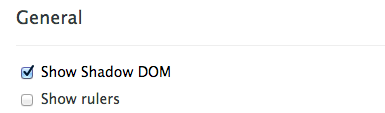
You can look at the Shadow Dom inside.For example, you can take a look at Shadow Dom in HTML 5. title 。
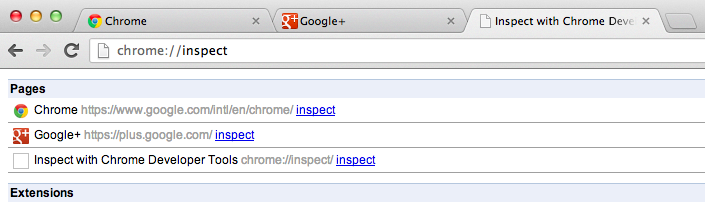
Preview all checkable pages
If you find that you have used Remote debugging, you may want to try "about: Inspect", which will show all the checkable tag / extensions in Chrome.Click "Inspect" to select a page and then load the development tool and jump to the corresponding page.
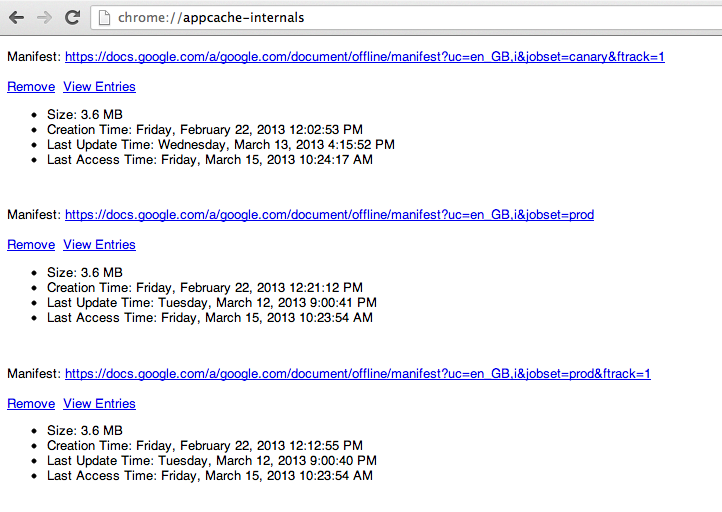
See which site has application cache in detail
By accessing "about: AppCache-Internals", you can see information about applying cache.This allows you to see which sites are cache when making changes, and how many space they take up.You can also remove these caches here:
Select multiple filters in the network / console panel
You may have realized that a filter can be used in the network and console panel, which allows you to narrow the scope of data based on different standards.
You may not know that you can use shortcuts (
Cmd
/
Ctrl
+ Click) to select a filter and apply it to the view.Below you can see the behavior of multiple panel keys:
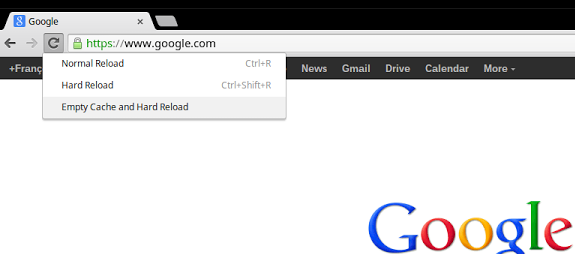
Clear the cache and overload
If you request a hard refresh, click and hold the Chromes' refresh button when the developer tool is opened.You should see a drop-down menu, which allows you to clean cache and hard overload.This helps save time!
Note: This is now only useful for Windows and Chromeos
In-depth understanding Chrome Task Manager
Task Management in Chrome allows you to learn about the GPU, CPU, and JavaScript memory usage, CSS, and script cache usage.
Follow the steps below to open task management:
- Click the Chrome menu in the browser toolbar.
- Select the tool.
- Select Task Manager.
- From there, you can get a program by right-clicking on any line to enter an extended view or by right-click.
Extension tool
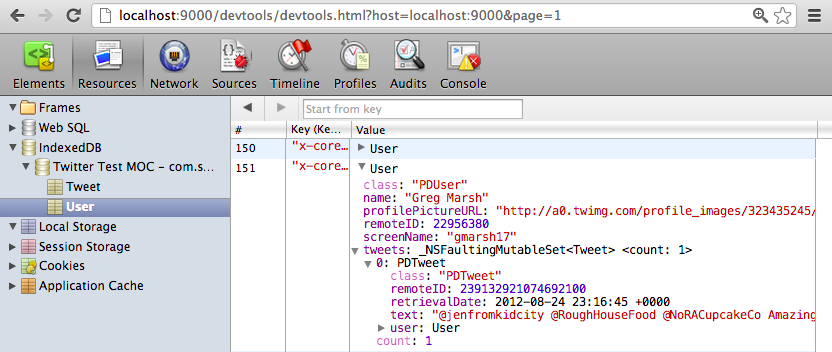
Test iOS application with developer tools
PonyDebugger It is a client library and a gateway server using the Chrome development tool to debug application network and manage object context.
JSRUntime: Developer Tool Retrieves the Expansion of JavaScript objects
Andrei Kashcha Write a very useful developer tool extension plugin, which can retrieve the available JavaScript objects and generate the appropriate graphs in the memory, and can also match according to the value or name.
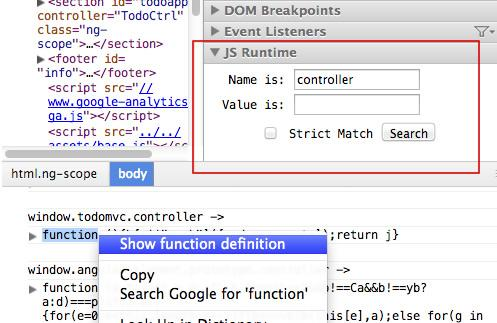
More: Jsruntime - Gets Developer Tools Extension Plugins for Objects