Chrome Development Tools Overview
May 26, 2021 Chrome A guide to developing tools
Table of contents
1. Overview of Google Chrome development tools
4. Check out the DOM and format
6. The debugging of JavaScript
7. Improve network performance
9. Improve rendering performance
Overview of Google Chrome development tools
Google Development Tools (short for developer tools below) are based on a set of web production and debugging tools included in Google Chrome. D eveloper tools allow web developers to drill down into the interior of browsers and web applications. The tool effectively tracks layout issues, sets JavaScript break points, and provides an in-depth understanding of your code's optimization strategy.
Note: If you're a web developer who also wants to get the latest version of the development tool, you should use the "nofollow" href""https://www.google.com/" rel"external nofollow target" version of the "_blank" and Google Chrome (canary) Canary version.
Use development tools
To use the development tool, open a web page or a Web application in Google Chrome directly. Another way:
-
Select the tool catalog of the browser's menu bar at the top right of the browser
 window, and
select the Developer Tools option.
window, and
select the Developer Tools option.
- Right-click anywhere on the page and select The Review element.
The development tool will open below the browser.
There are a few shortcuts that you can also use to open development tools:
Ctrl
s
Shift
s
I
(or use
Cmd
s Opt s
Opt
I
Ctrl
s
Shift
s
J
(or use
Cmd
s
Opt
s
J
on your Mac to open developer tools while focusing on the console.
Ctrl
s
Shift
s
C
(or use
Cmd
Shift
s
C
on your Mac) to open the developer tool in review mode or to turn on the access option when the developer tool is already turned on.
Learning to use shortcuts can save you time on your daily workflow.
Developer tool window
Task-related groups are arranged in the toolbar at the top of the developer tool window. Each toolbar item and corresponding panel allows you to work with specific information about a web page or application, including DOM elements, resources, and sources.

Pictured is the color selector in the developer tool.
Overall, there are eight main tools available for viewing development tools:
You can
Ctrl
[
Ctrl
]
to move between panels.
Check out the DOM and format
The Element Panel lets you see all the relevant information about a DOM tree and allows you to examine and edit DOM elements during transmission. E lement tags are frequently accessed when you need to confirm HTML snippts for certain aspects of the page. For example, when you are curious about what the HTML id properties and values of an image are.
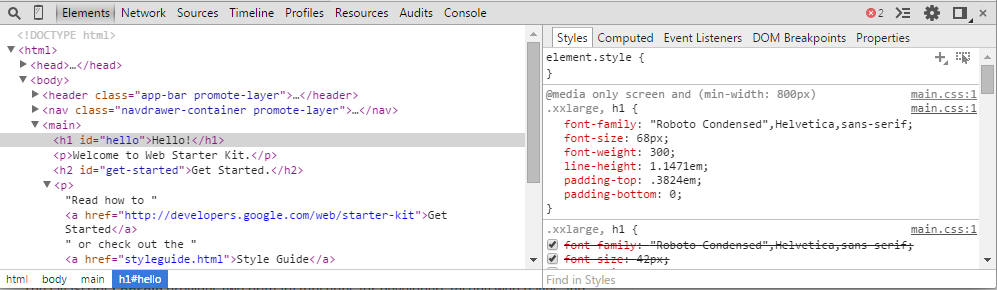
View the title element in the DOM.
Read more about the DOM and format
Work with the console
The JavaScript console provides developers with two main features for testing Web pages and applications, including:
-
Record diagnostic information during development.
- A shell prompt that interacts with documents and tools.
You can use the method provided by the console programming interface to record diagnostic information. Such as console .log () or console.profile().
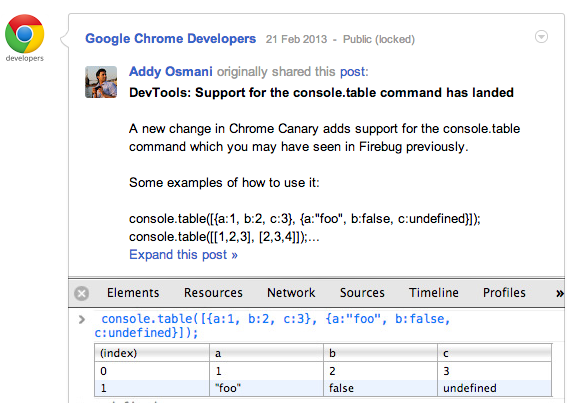
You can evaluate expressions directly in the console and use the methods provided by the command line. These include selecting elements using the $() command or starting the CPU Analyzer command using the profile() method.
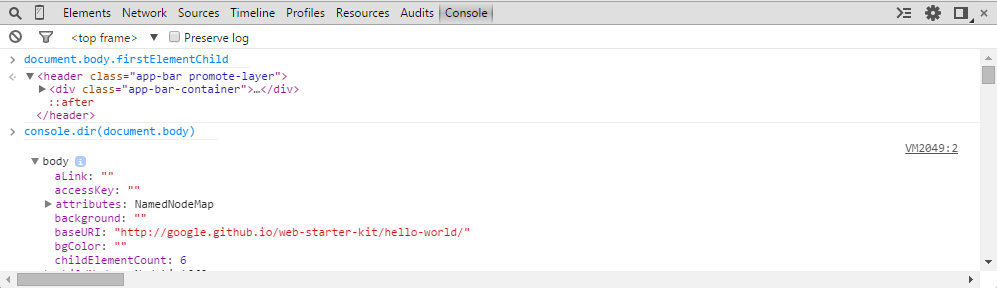
Evaluate some commands on the JS console.
Read more about the working console
The debugging of JavaScript
As the complexity of JavaScript applications increases, developers need powerful debugging tools to help developers quickly identify the cause of the problem and find effective solutions. The Chrome development tool contains some useful tools to make debugging JavaScript easier.
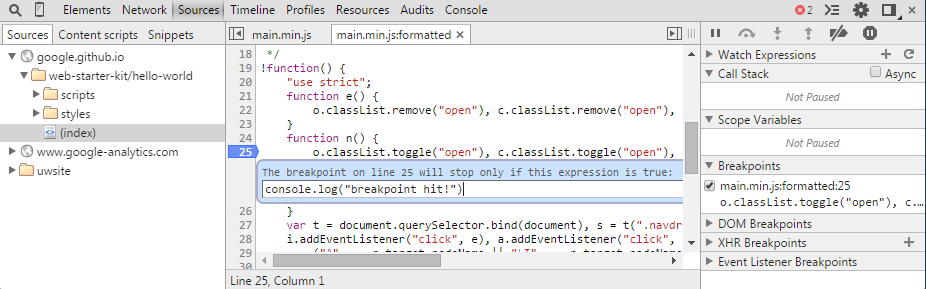
A condition break point that outputs logs in the console.
Read more about how to apply debugging tools to debug JavaScript
Improve network performance
The Network panel provides a detailed analysis of resources that have been downloaded and loaded. During the basic process of optimizing the page, it usually takes longer than expected to identify and locate those requests.
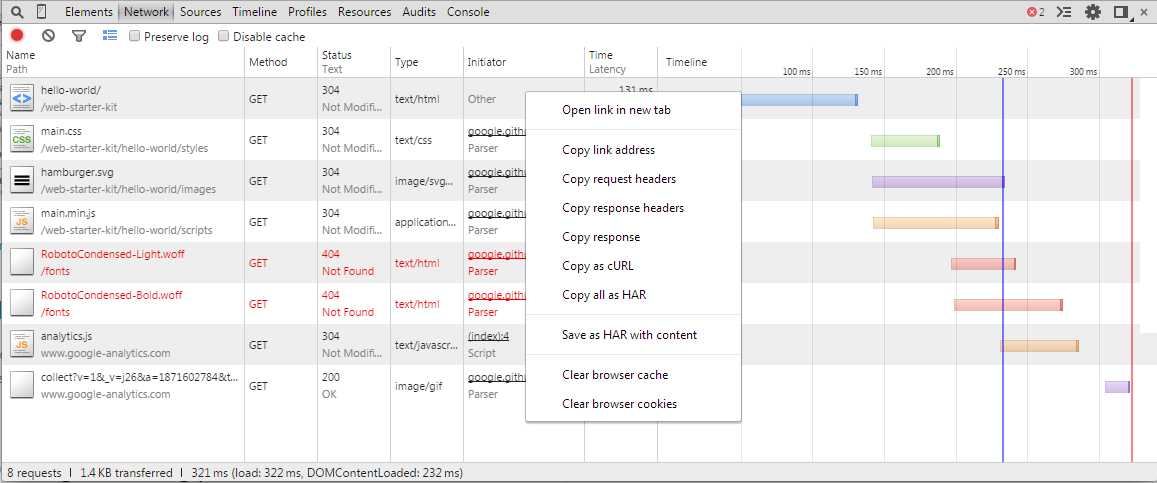
The context menu for the network request.
To learn more about how to improve the performance of your network, click here
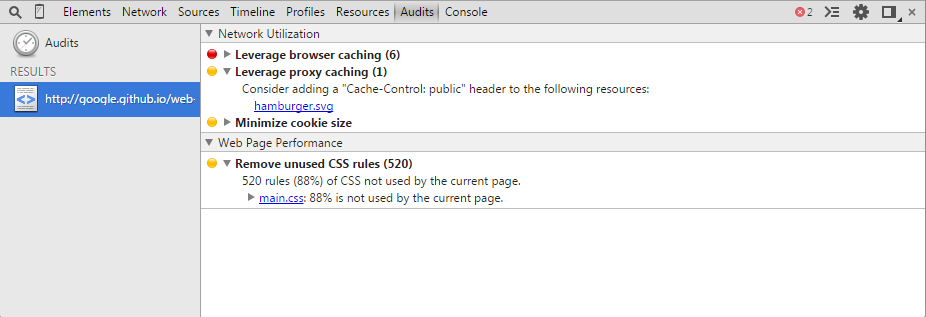
Audit
The audit panel can analyze a page as it did when it was loaded. T hen provide suggestions and optimizations for reducing page load times to improve perceived (and real) responses. To learn more about this feature, we recommend pagespeed.
Improve rendering performance
When loading and using your web application or web page, the Timeline panel gives you a complete overview of the time overhead. All events, from loading resources to parsing JavaScript, and how they are calculated, are redrawn in a timesheet.
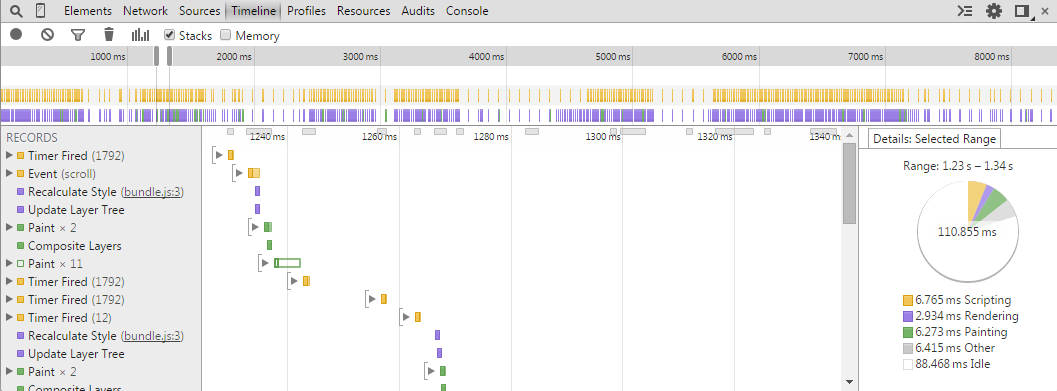
An example of a timeline with multiple times.
Read more about how to improve rendering performance
The performance of JavaScript and CSS
The Configuration panel allows you to configure execution time and memory usage for network applications or pages. T hese help you understand the consumption of resources to help you optimize your code. The analyzers provided are:
- Cpu Analyzer shows when the JavaScript function on your page was executed
- The heap memory allocator displays the Page's JavaScript objects and DOM nodes.
- The JavaScript profile shows when the script was executed.
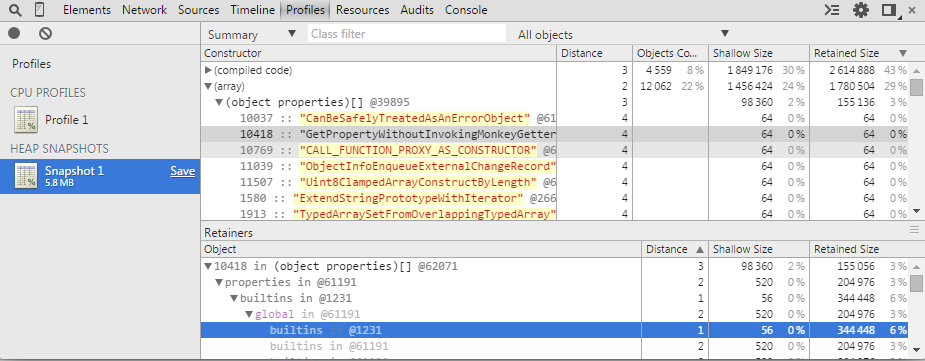
An example of a heap snapshot.
Read more about how using JavaScript and CSS can improve performance
Monitor storage
The Resources panel allows you to monitor the resources loaded on the page. It allows you to use HTML5 for local storage, databases, caches, appcache, etc.
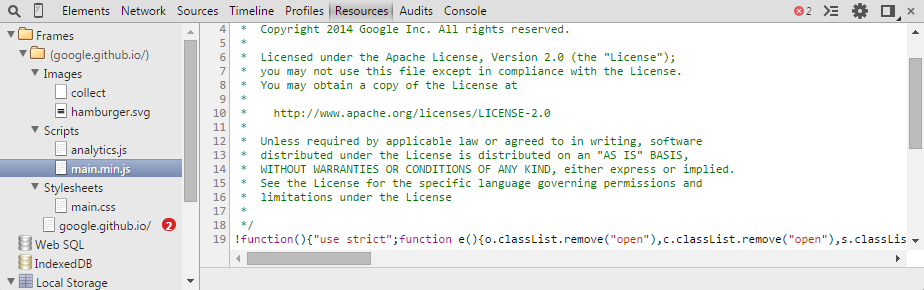
Web Starter Kit's JavaScript files appear in the Resources panel.
To read more about monitoring storage, click
Read on
There are other development tool documentation content that will have something useful for you. These include:
More resources
Get more
You can also @chromiumdev us on the website or use the forum to ask questions.
The style output in the console.
Make sure to check the Google Chrome development page on Google Plus.
Participation
To submit a bug error or feature request for a tool, use problem http://crbug.com in the file. Please also mention the "tools" in the error summary.
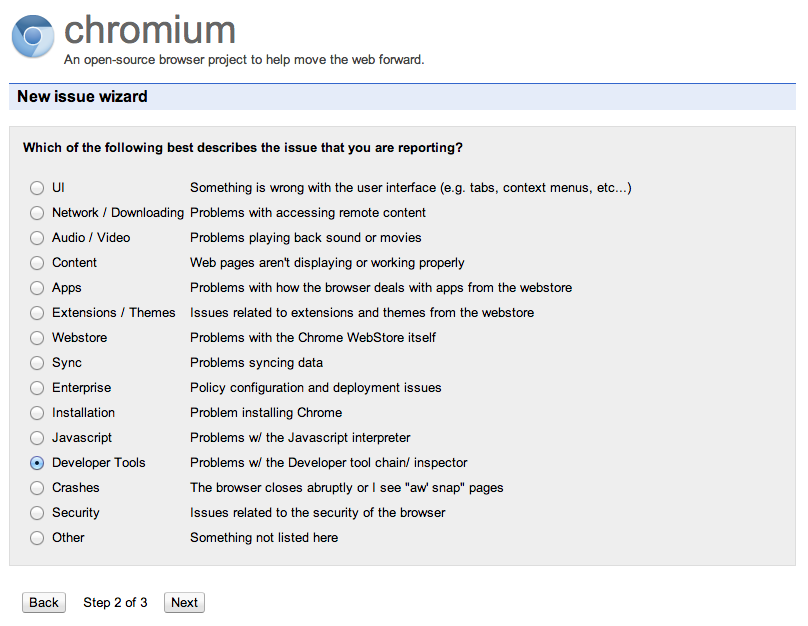
crbug.com the error reporting class selector.
Please give us a direct feedback to make the developer tools better.
Debug the extension
Want to use tools to debug Chrome extensions? W atch develop and debug extensions. This tutorial can also be used for debugging .