Chrome Development Tools Console API Reference
May 26, 2021 Chrome A guide to developing tools
Table of contents
2. console.assert(expresson,object)
5. console.debug(object [, object, ...])
8. console.error(object [, object, ...])
9. console.group(object[, object, ...])
10.. console.groupCollapsed(object[, object, ...])
12.. console.info(object [, object, ...])
13.. console.log(object [, object, ...])
18.. console.timeStamp([label])
Console API reference
The Console API provides web applications with a way to enter information into the console, create JavaScript files, and start debugging sessions.
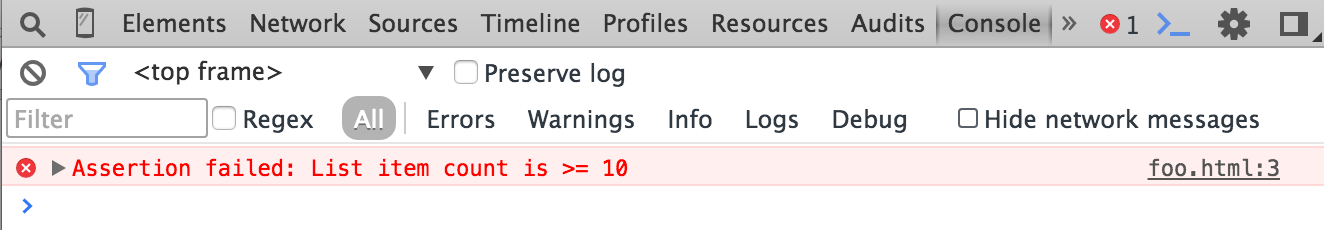
console.assert(expresson,object)
If the specified expression returns false, the return result is entered into the console along with a stack tracker. In the following example, the assertion message is entered into the console as long as the document contains fewer than 10 child nodes.
 var list =  document.querySelector('#myList');
 console.assert(list.childNodes.length < 10, "List item count is >= 10");
console.clear()
Clear the console
console.clear();Also visible in clear console.
However, if Preserve Logs is on, it won't do anything when some frameworks call
console.clear()
which makes your debugging process even more difficult.
Clear console still works in the main menu, clearing the console's information.
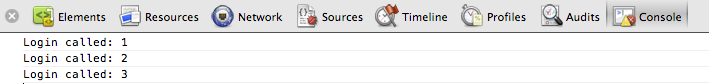
console.count(label)
This function
count()
number of times the same label is called on the same line.
In the following example,
login()
function is
count()
is also called.
function login(user) { console.count("Login called"); // login() code...}
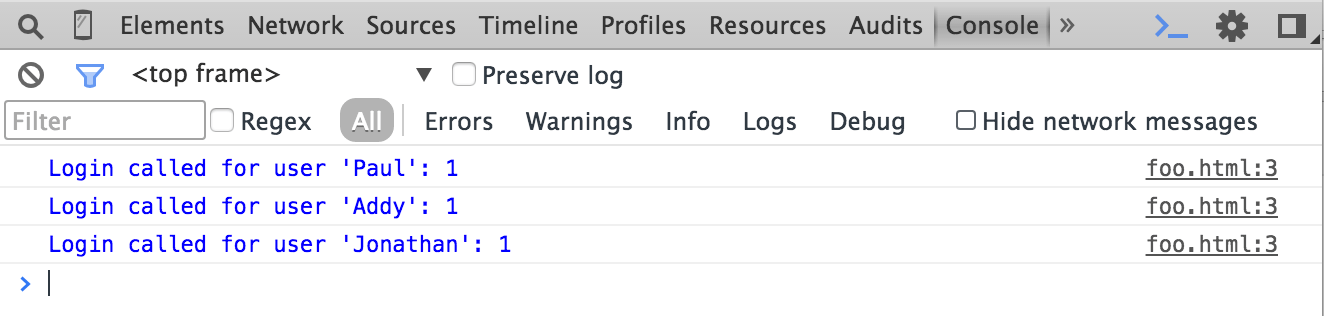
In this example,
count()
called in a different label, and each return result is increased separately (not added up).
function login(user) { console.count("Login called for user '" + user + "'"); // login() code...}
console.debug(object [, object, ...])
This approach is
console.log()
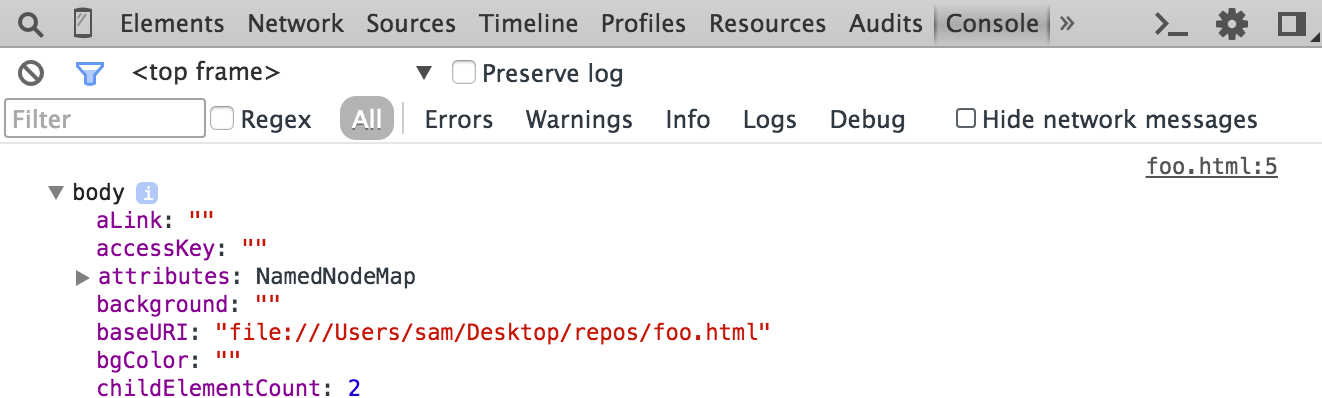
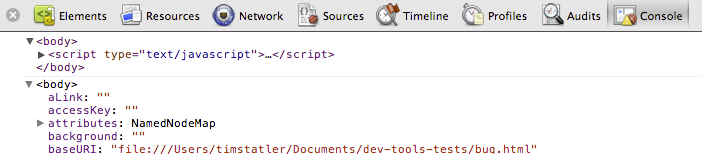
console.dir(object)
Outputs a description of JavaScript for the specified object. If the logged object is an HTML element, the properties of its DOM object are output, as follows:
console.dir(document.body);
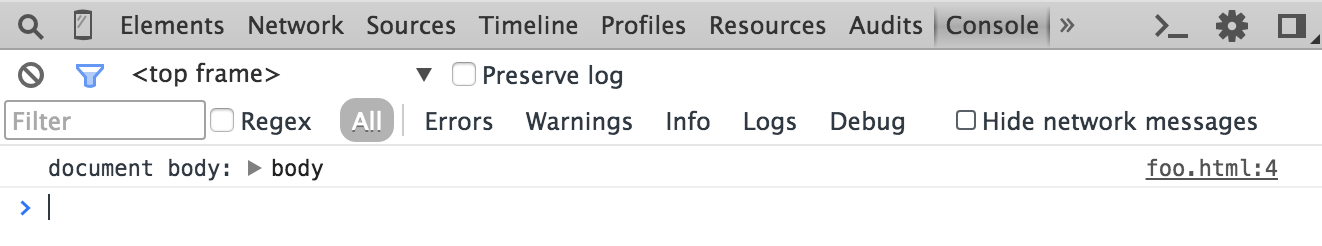
You can also use
console.log()
in a console() statement to output the JavaScript property of an element:
console.log("document body: %O", document.body);
Calling
console.dir()
object is equivalent to calling console .log on the same object.
They all output the Javascript property of the object as a tree.
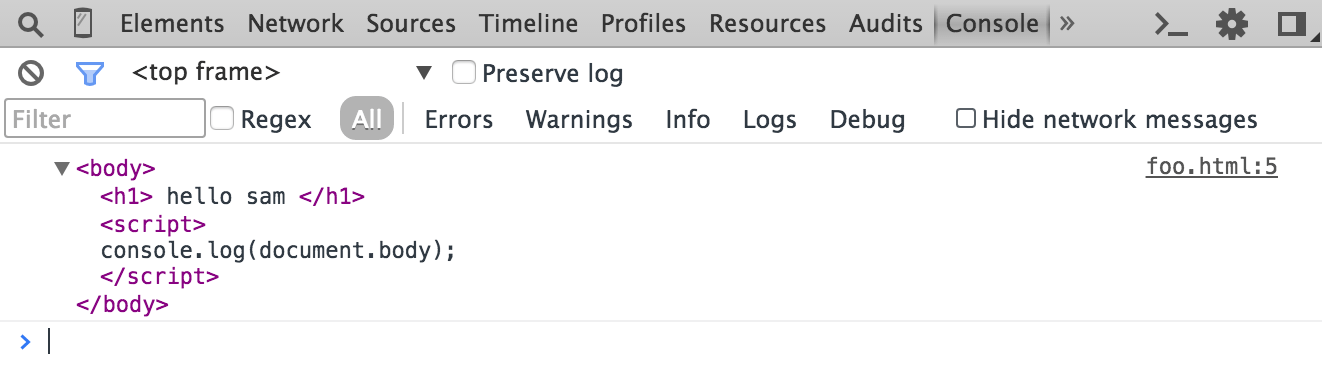
Comparing
console.log()
of console
console.log()
outputs elements in XML format and outputs in the Elements panel:
console.log(document.body);
console.dirxml(object)
Outputs the XML form of a specified object, which appears in the Elements panel.
For HTML elements, calling this method is equivalent
console.log()
console.
var list = document.querySelector("#myList");console.dirxml();-
%0is a short case of dir -
%odepends on the object type (no DOM or DOM) whether it is the same as dir or dirxnl
console.error(object [, object, ...])
Similar
to console .log (),
console.error()
a stack tracker is also included where the method is called.
function connectToServer() { var errorCode = 1; if (errorCode) { console.error("Error: %s (%i)", "Server is not responding", 500); }}connectToServer();

console.group(object[, object, ...])
Start a new record group with an optional title item.
After calling this method and
console.groupEnd()
all console outputs are in the same viewgroup.
console.group("Authenticating user '%s'", user);console.log("User authenticated");console.groupEnd();

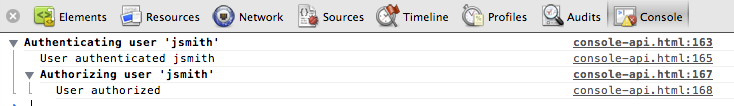
You can also nest groups:
// New group for authentication:console.group("Authenticating user '%s'", user);// later...console.log("User authenticated", user);// A nested group for authorization:console.group("Authorizing user '%s'", user);console.log("User authorized");console.groupEnd();console.groupEnd();
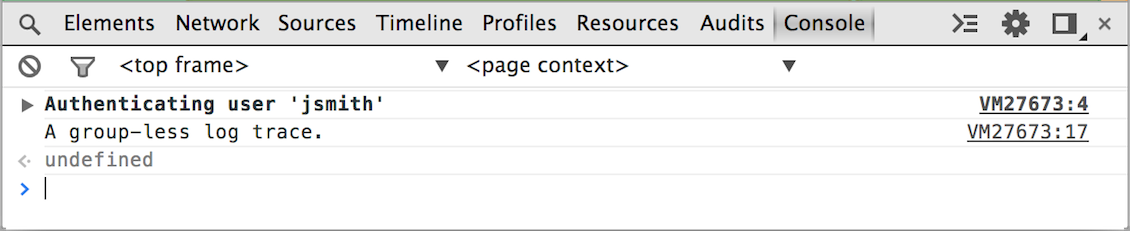
console.groupCollapsed(object[, object, ...])
Create an initial closed rather than open record group, just
console.group()
console.groupCollapsed("Authenticating user '%s'", user);console.log("User authenticated");console.groupEnd();console.log("A group-less log trace.");
console.groupEnd()
Close the record
console.group()
console.groupCollapsed()
See
console.group ()
and
console.groupCollapsed() for example.
console.info(object [, object, ...])
This method is equivalent .log console's system().
console.log(object [, object, ...])
This method outputs a message in the console. P
ass one or more objects as arguments to this method, each of which is calculated separately and connected into a spatially separated string. T
he first
log()
which may contain a format description
(format specifiers).
A marker string consists of a percent sign (%), followed by a letter, to indicate the format to be applied.
DevTools supports the following format captions:
| name | age |
|---|---|
| %s | String format |
| %d or %i | The integer format |
| %f | Floating point format |
| %o | Extensable DOM elements (in the Elements panel) format |
| %O | Extensable Javascript object format |
| %c | Output in the CSS-style format you provide |
Basic examples:
console.log("App started");The following is an example of inserting the included variable userName and userPoints values using the string (%s) and integer (%d) formats:
console.log("User %s has %d points", userName, userPoints);

Here is an example of using element format (%o) and object format (%0) in the same DOM element:
console.log("%o, %O", document.body, document.body);
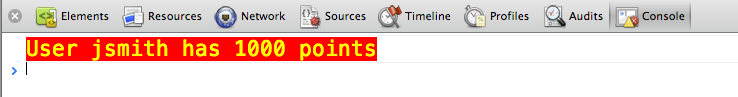
The following example uses the %c format to illustrate the colored output string:
console.log("%cUser %s has %d points", "color:orange; background:blue; font-size: 16pt", userName, userPoints);
console.prifile([label])
When Chrome DevTools is turned on, call this function with an optional tag to turn on a JavaScript CPU state analysis. T
o complete this analysis, call
console.profileEnd()
method.
Each analysis is added to the Profiles tab.
In the following example, CPU state analysis starts at a function entry and consumes too much CPU resources, and ends when the function exits.
function processPixels() { console.profile("Processing pixels"); // later, after processing pixels console.profileEnd();}console.profileEnd()
When only one session is in, stop the JavaScript analysis session for the current CPU and output the results to the Profiles panel.
console.profileEnd()See console.profile() for more examples.
console.time(label)
Start a new timer, associated with the label. W
hen
console.timeEnd()
called by the same label, the timer stops timing, showing the passing time in the console.
The value of the timer is accurate to sub-milliseconds.
console.time("Array initialize");var array= new Array(1000000);for (var i = array.length - 1; i >= 0; i--) { array[i] = new Object();};console.timeEnd("Array initialize");

Note: Strings passed to the time() and timeEnd() methods must match the value returned at the end expected by the timer.
console.timeEnd(label)
Stop the timer for the specified label and output the time it has passed.
For examples, see console.time().
console.timeStamp([label])
This method adds an event to the timeline during recording. This allows you to visually associate generated code on timestamps to other events, such as screen layout and drawing, which are automatically added to the timeline.
Mark the timeline with console.timeStamp().
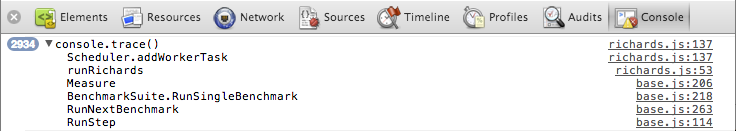
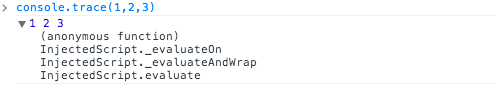
console.trace(object)
Outputs a stack trace path from the point at which the method was called, including links to specific lines in the Javascript source code.
The counter
trace()
is called at that point, as shown on the screen below.
It is also possible to pass in parameters into
trace
for example:
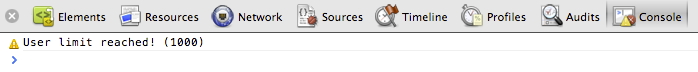
console.warn(object [, object, ...])
This method is much .log console, but also outputs a log message with a yellow warning icon.
console.warn("User limit reached! (%d)", userPoints);
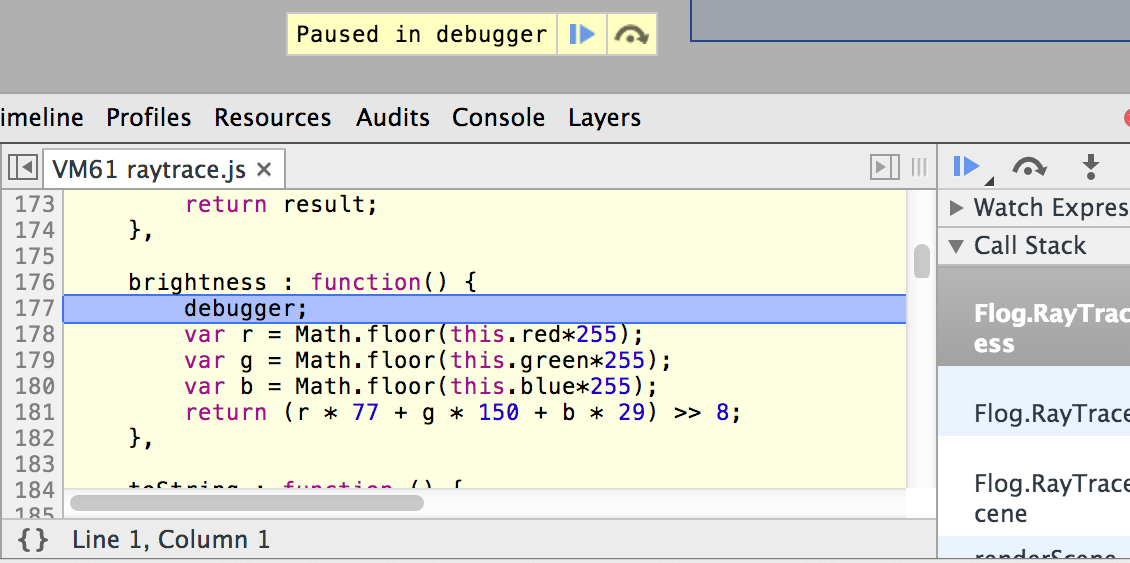
debugger
The global debugger feature stops Chrome from executing the program and starts a debugging session on the line on which it is called. It's the equivalent of setting a "manual" break point on Chrome DevTools' Sources tab.
Note: The debugger command is not a method for console objects.
In the following example, when an object's
brightness()
called the JavaScript debugger is opened:
brightness : function() { debugger; var r = Math.floor(this.red*255); var g = Math.floor(this.green*255); var b = Math.floor(this.blue*255); return (r * 77 + g * 150 + b * 29) >> 8;}