Chrome Development Tool Using the console
May 26, 2021 Chrome A guide to developing tools
Table of contents
Use the console
The console lets you:
- Log diagnostic information can help you analyze errors on web pages or apps
- Enter commands to interact with documents and Chrome developer tools
You may also evaluate general JavaScript expressions yourself. T his document provides a preview of the console and an overview of general use. You can learn more by browsing the Console API and the Conmmand Line API reference material.
The underlying operation
Open the console
The Javascript console can be opened in two places. T he console panel is the primary entry point. I t can also be opened in any other panel by using drawers. Open the control panel and select one of the methods provided below:
-
Use the keyboard
CommandsOptionsJ(Mac) orControlShitfJ(Windows/Linux). -
Select
 more Tools and JavaScript Console.
 A clean console interface
To open the drawer console, you need to press
Esc
on the keyboard or click the Show Drawer button in the upper right corner of the developer's tool window.
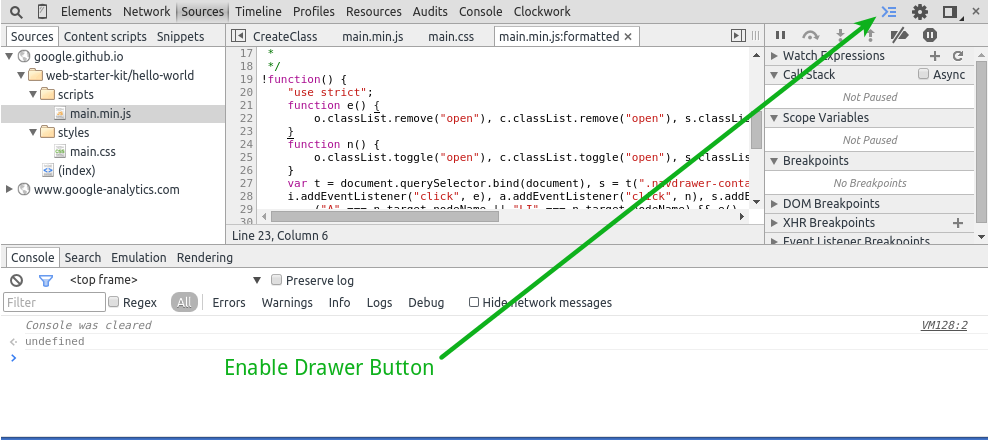 Drawer-style console on the element panel
Clear console history information
To clear console history information, you need to do this:
- Right-click or hold Ctrl in the console and select Clear Console from the context menu
- Enter the clear() command line API in the shell prompt.
- The console API is called console.clear() in Javascript.
-
Use the keyboard
CmdsKsL(Mac)CtrlL(Linux and Windows).^
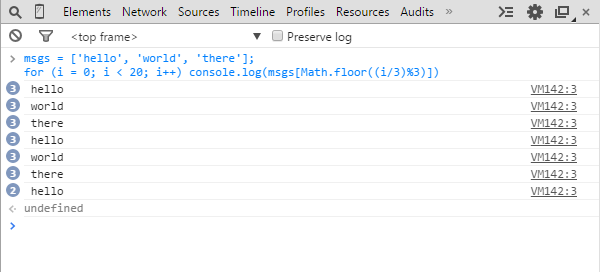
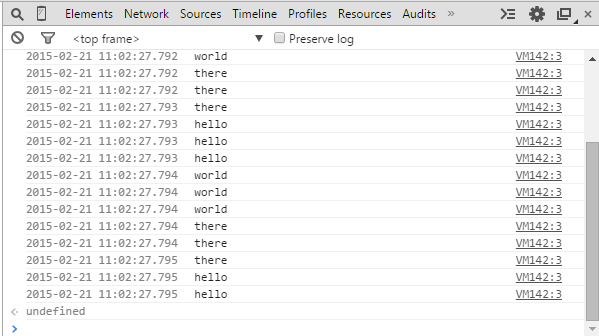
The information stack
The console continuously outputs the same information as a stack. This makes the information provided to you as brief as possible.
| Prohibit timestamps (default) | Timestamps are allowed |
|---|---|
|
|
An example of two stack states
Simple code to test console mode
msgs = ['hello', 'world', 'there'];
for (i = 0; i < 20; i++) console.log(msgs[Math.floor((i/3)%3)])
Select the frame
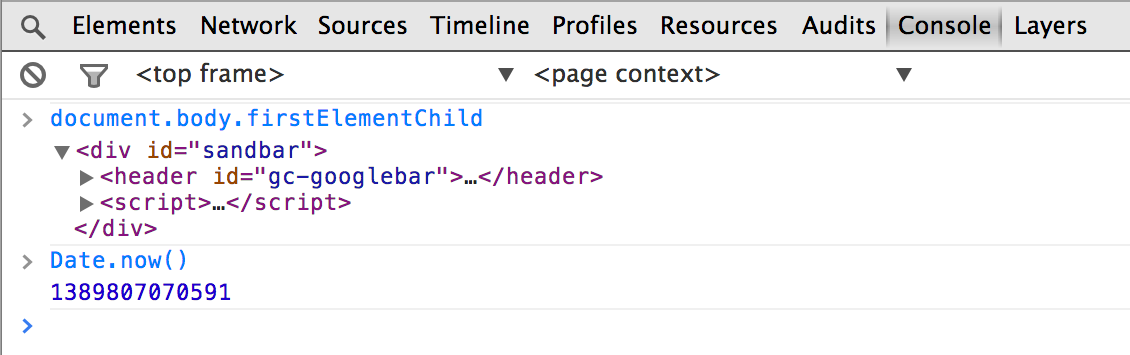
The console can run in different frames of the page. T he home page is the outermost frame of the document. T ake the iframe element, for example, which creates its own contextual framework. You can also specify this frame by using the pull-down box next to the filter button.
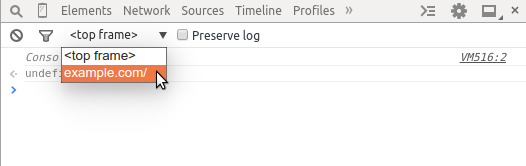 Select a secondary frame
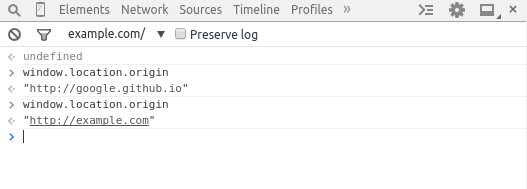 This image shows how the window source changes in the top-level frame and the selected secondary frame.
Use the console API
The console API is a collection of methods that are provided by a global console object
console
the developer tool. O
ne of the main purposes of the API is to output log information to the console while your app is running.
You can also group output information in the console to reduce visual clutter.
Output to the console
Console .log () method uses one or more expressions as arguments, and then outputs their current values to the console.
A simple example of output to the console:
var a = document.createElement('p');
a.appendChild(document.createTextNode('foo'));
a.appendChild(document.createTextNode('bar'));
console.log("Node count: " + a.childNodes.length);
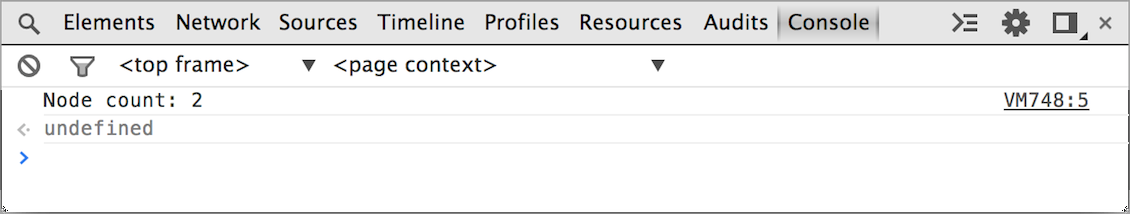 An example of output in the console
Multiple parameters are concatened into finite rows.
Console for multiple .log ().
console.log("Node count:", a.childNodes.length, "and the current time is:", Date.now());
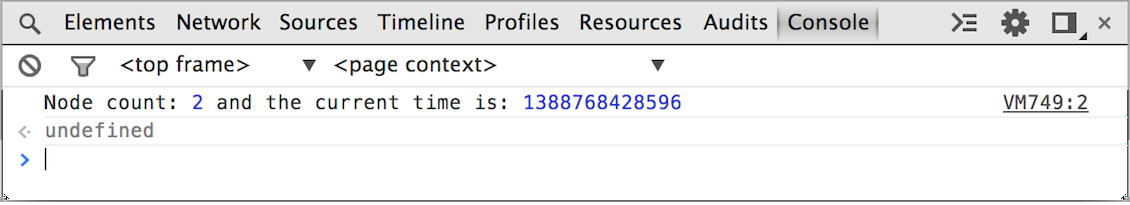 Multi-parameter console .log output of ().
Errors and warnings
Errors and warnings are displayed in the same way as general log information. T he difference is that error() and warn() attract attention through their own styles. or() method shows a red icon with red message text. The console.warn() method shows a yellow icon and yellow message text.
Use the console warn and error methods.
Use the error() method.
function connectToServer() {
    console.error("Error: %s (%i)", "Server is  not responding",500);
}
connectToServer();
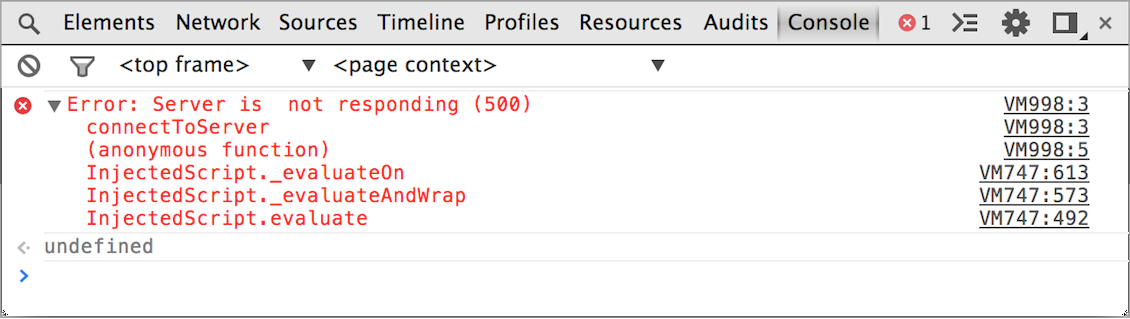
How connectToServer() is displayed in the console.
Use the warn() method
if(a.childNodes.length < 3 ) {
    console.warn('Warning! Too few nodes (%d)', a.childNodes.length);
}
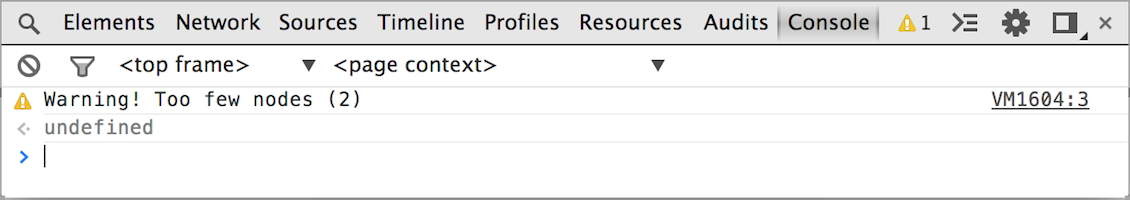 An example of a warning output.
Assertion
The console.assert() method displays an error message string (its second argument) only if its first argument is false
An example of a simple assertion and how to present it.
In the following code, if the number of child nodes in the list exceeds 500, an error message is caused in the console.
console.assert(list.childNodes.length < 500, "Node count is > 500");
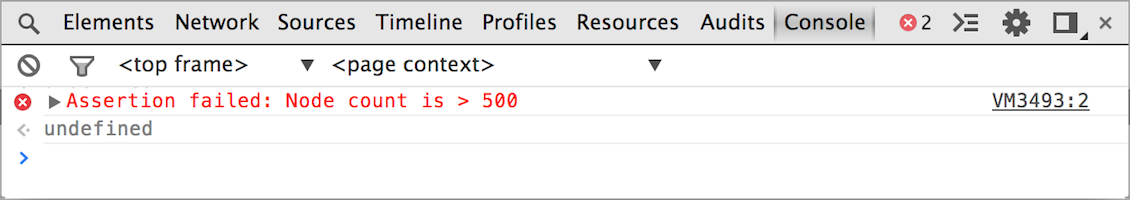 How a failed assertion appears in the console.
Filter the output of the console
You can filter the output of the console by the level of security in the filter options. A ctivate the filter by using the filter icon in the upper left corner of the control panel. The following filter options are available:
| ALL | All console outputs are displayed |
|---|---|
| Errors | Only the information output of console.error() is displayed |
| Warnings | Only the information output of console.warn() is displayed |
| Info | Only the information console.info () output is displayed |
| Logs | Only the information .log console() output is displayed |
| Debug | Only the information output of console.timeEnd() and console.debug() is displayed |
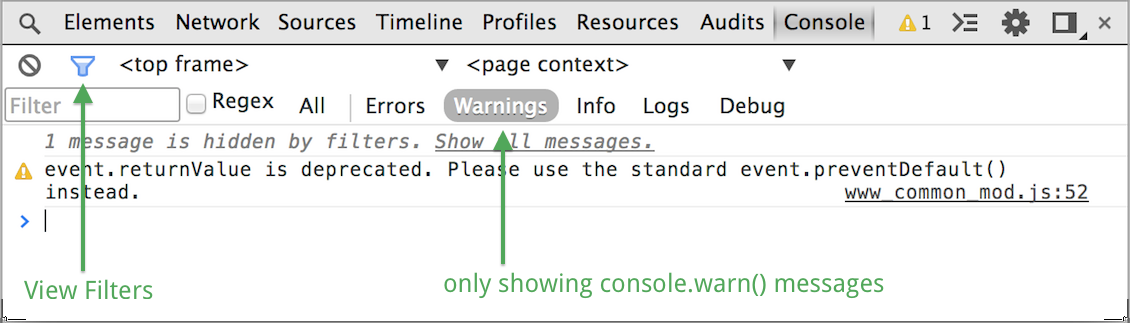 The filter displays only error-level information.
Output grouping
You can group the associated output information together by grouping commands. roup command names your group by the parameters of a string. T he console will combine all the output information together. To end the grouping, you only need to call groupEnd.
An example of a grouping
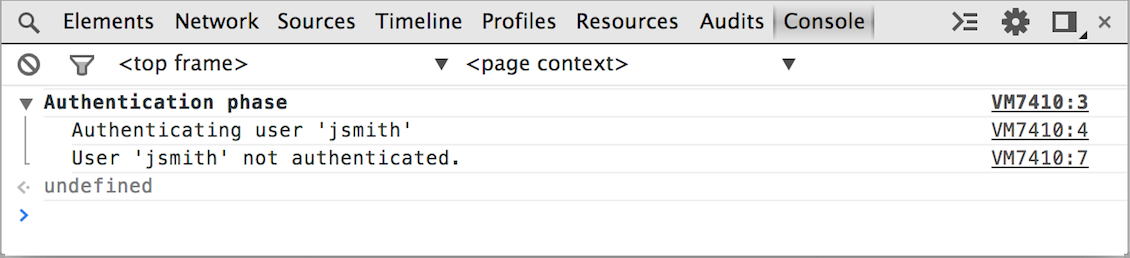
Example code:
var user = "jsmith", authenticated = false;
console.group("Authentication phase");
console.log("Authenticating user '%s'", user);
// authentication code here...
if (!authenticated) {
    console.log("User '%s' not authenticated.", user)
}
console.groupEnd();
The sample output
The grouping of log information may also be nested with each other, which is useful for looking at large amounts of information at once in a small space.
This sample code shows a log grouping for the validation phase in a login program.
The code is as follows:
var user = "jsmith", authenticated = true, authorized = true;
// Top-level group
console.group("Authenticating user '%s'", user);
if (authenticated) {
    console.log("User '%s' was authenticated", user);
    // Start nested group
    console.group("Authorizing user '%s'", user);
    if (authorized) {
        console.log("User '%s' was authorized.", user);
    }
    // End nested group
    console.groupEnd();
}
// End top-level group
console.groupEnd();
console.log("A group-less log trace.");
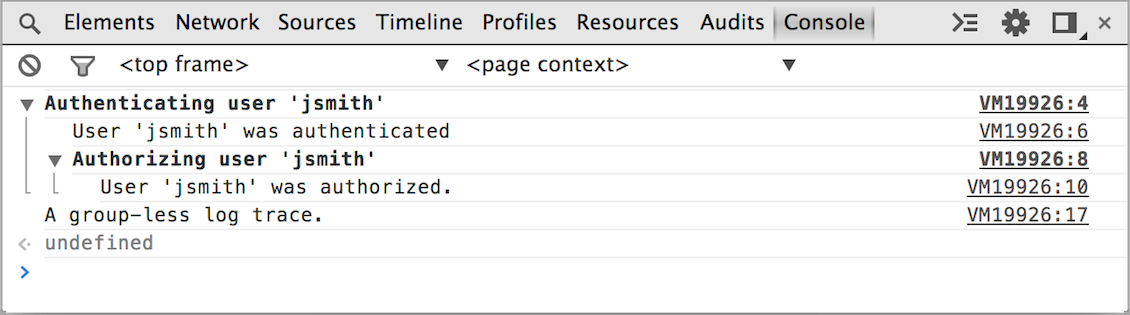 Nested grouping output information in the console.
When you group output information multiple times, you don't have to see all the output information directly, which is useful. You can automatically group information by calling groupCollapsed() instead of the previously used group().
console.groupCollapsed() how to use it
Example code:
console.groupCollapsed("Authenticating user '%s'", user);
if (authenticated) {
    ...
}
console.groupEnd();
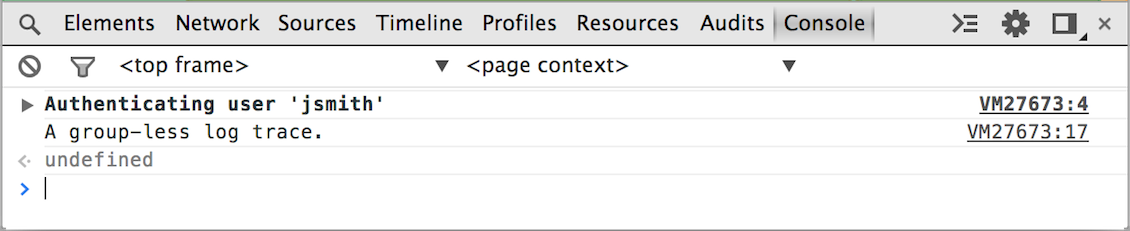 GroupCollapsed() output information
Browse structured data
The table() method provides an easy way to view similar data objects. T his gives a data property and creates a header. Row data is obtained from each index property value.
Display of an example in the console that uses 2 arrays.
Example code:
console.table([{a:1, b:2, c:3}, {a:"foo", b:false, c:undefined}]);
console.table([[1,2,3], [2,3,4]]);
The result of the sample code output:
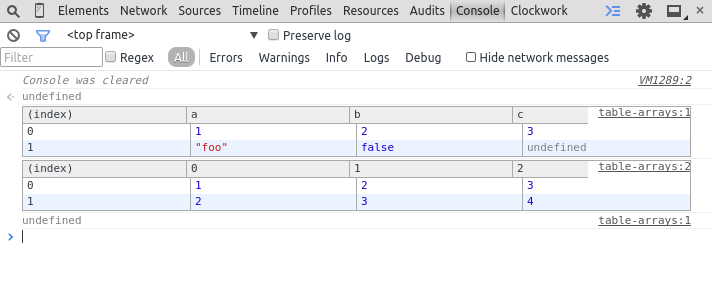
The second argument in table() is optional. You can define any array of property strings that you want to display.
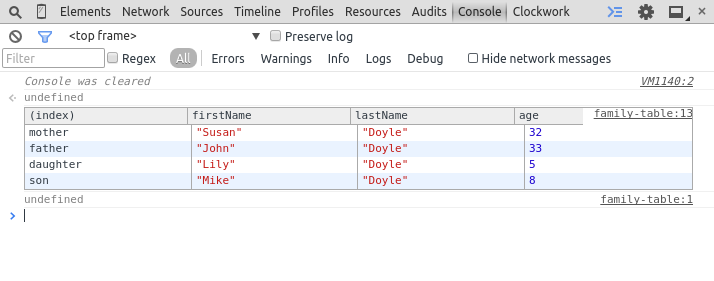
A console output table that uses a collection of objects.
Example code:
function Person(firstName, lastName, age) {
  this.firstName = firstName;
  this.lastName = lastName;
  this.age = age;
}
var family = {};
family.mother = new Person("Susan", "Doyle", 32);
family.father = new Person("John", "Doyle", 33);
family.daughter = new Person("Lily", "Doyle", 5);
family.son = new Person("Mike", "Doyle", 8);
console.table(family, ["firstName", "lastName", "age"]);
The output of the sample code:
The replacement and formatting of strings
The first argument of any log method may contain one or more format descriptors. A descriptor consists of % symbol and a character that follows it, which defines the value used for formatting. The string that this parameter follows is what is displayed in the placeholder.
The following example uses string and number formats to insert the string to be output. You'll see that Sam has 100 points in the console.
console.log("%s has %d points", "Sam", 100);The full format caption is as follows:
| %s | Format as string |
|---|---|
| %i or %d | Format as integer |
| %f | Format into a floating-point type |
| %o | Format into an extensable DOM element. Just as you can see in the element panel |
| %o | Format into a scalable JavaScript |
| %c | Apply a CSS-style output string with the second argument |
This example uses a numeric placeholder to format the value of document.childNodes.length. It also uses placeholders of floating-point types to format Date.now();
The code is as follows:
console.log("%s has %d points", "Sam", 100);示例替代的输出A preview of the output of the sample code
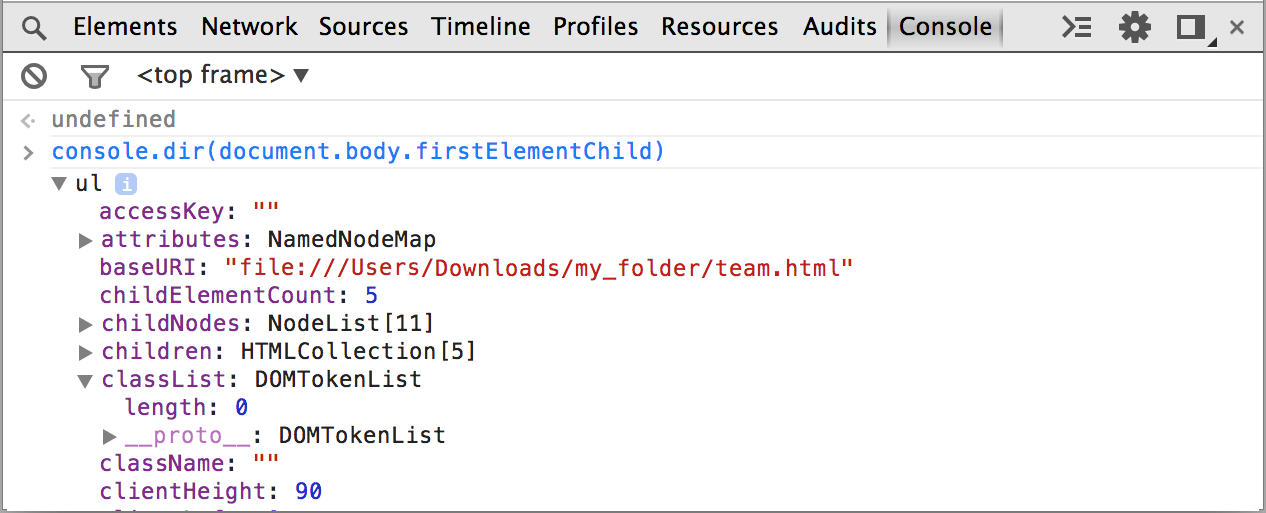
Format the DOM element as a JavaScript object
When you want to record a DOM element in the console, it appears in XML format. T he same display is displayed in the element panel. To display information in JavaScript format, you can replace your JavaScript with a dir() method or a placeholder in log().
The difference between the two different displays:
| Log() view | Dir() view |
|---|---|
|
|
Use the CSS style to change the console output
The CSS format descriptor modifies the style of the output in the console. Start with the text you want to decorate with placeholders, and then write the style you want to show in the second argument.
Change the log style
Example code:
console.log("%cThis will be formatted with large, blue text", "color: blue; font-size: x-large");
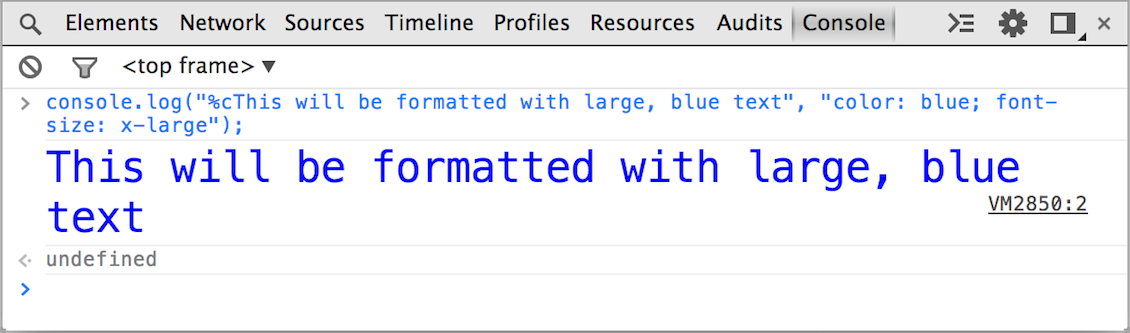 The output of the sample code.
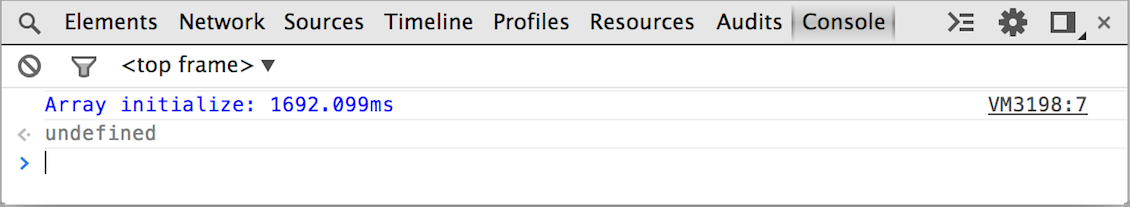
Calculate the time cost
The time() method allows you to start a timer. Y ou must enter a string to recognize the marker of time. W hen you want to end the calculation, use the timeEnd() method and pass the same string to the constructor. The console records the label and the cost of time at the end of the timeEnd() method.
Sample code and output for JavaScript execution time:
Example code:
console.time("Array initialize");
    var array= new Array(1000000);
    for (var i = array.length - 1; i >= 0; i--) {
        array[i] = new Object();
    };
console.timeEnd("Array initialize");
Output on the console:
When
time()
method is executing, a timeline record
is generated
and annoted.
This is useful for tracking your app's use and its origin.
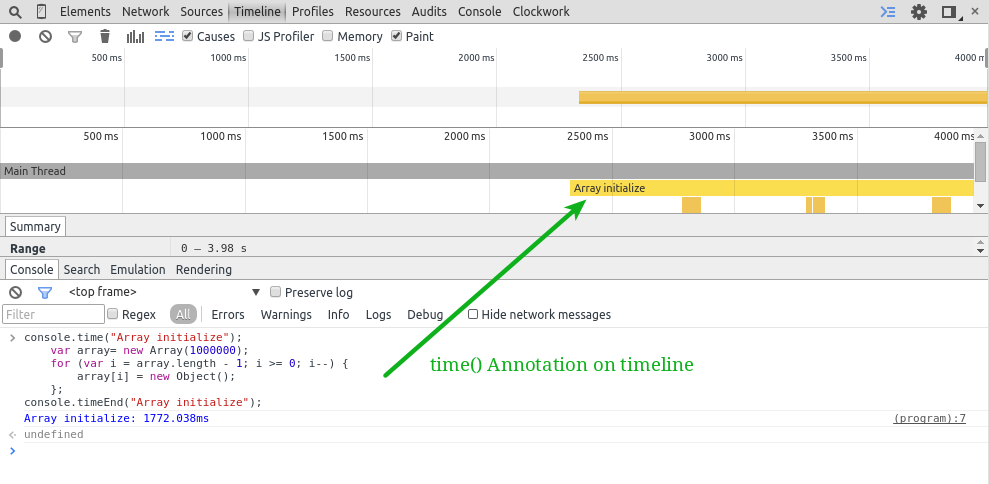 time() Execute how the annotations on the timeline are displayed.
Make a timeline
The Timeline Panel provides
a complete overview of engine time overhead. Y
ou can call
timeStamp()
console to add a tag to the timeline.
This is an easy way to associate your app's events with other events.
Note: The
timeStamp()method can only be used when the timeline record is running.
timeStamp()
annotations the timeline in the following places:
- At the yellow vertical line in the summary and detailed view of the timeline
- A record was added to the list of events
The sample code is as follows:
function AddResult(name, result) {
    console.timeStamp("Adding result");
    var text = name + ': ' + result;
    var results = document.getElementById("results");
    results.innerHTML += (text + "<br>");
}
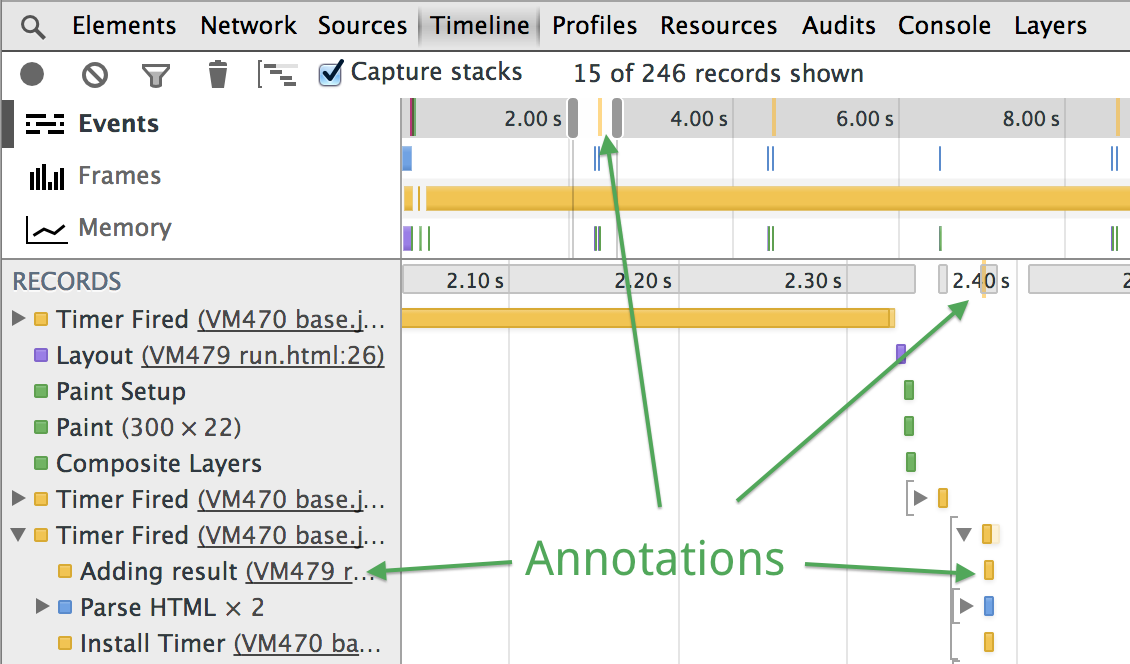 The timestamp in the timeline
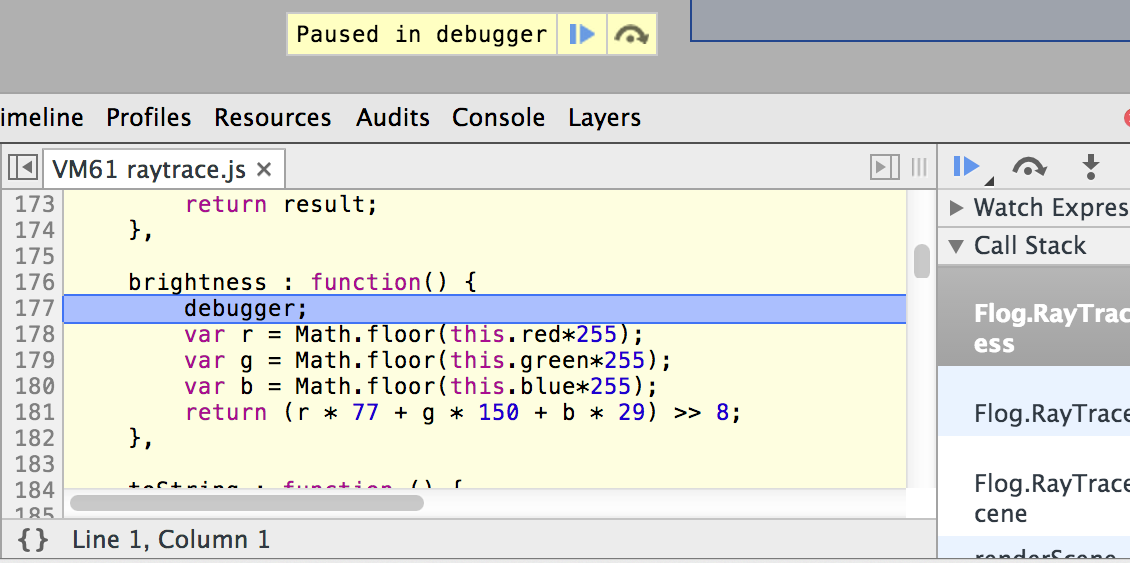
Set break points in JavaScript
The debugger declares that a debugging session will be opened. This is equivalent to setting a break point on the script in this line.
Use brightness() to open a debugging session.
Example code:
brightness : function() {
    debugger;
    var r = Math.floor(this.red*255);
    var g = Math.floor(this.green*255);
    var b = Math.floor(this.blue*255);
    return (r * 77 + g * 150 + b * 29) >> 8;
}
The output of the sample code:
Record the execution of the statement
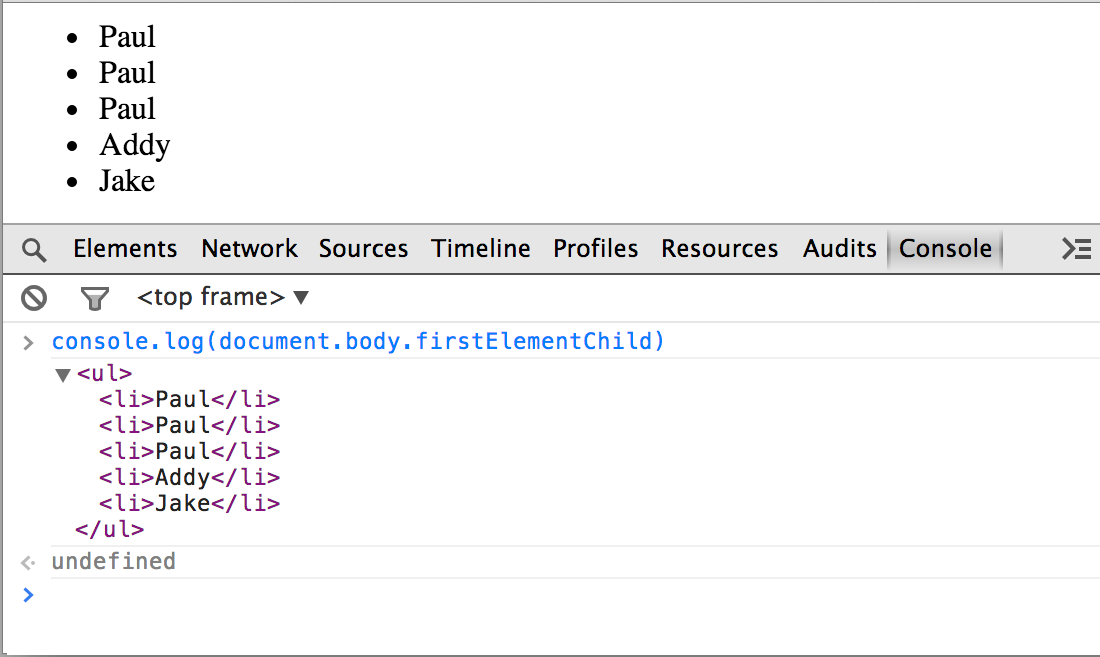
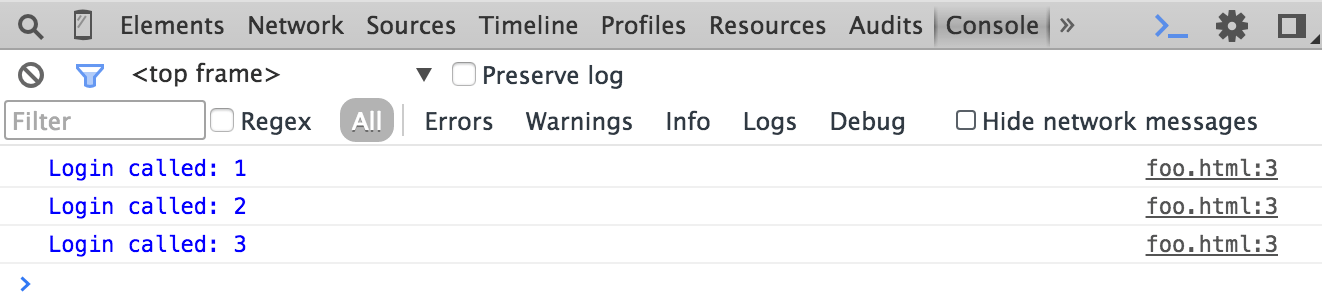
The count() method records the provided string and the number of times it has appeared over a period of time. T his string may contain dynamic content. The count increases when an identical string has been passed to count().
Examples of count() using dynamic content:
Example code:
function login(user) {
    console.count("Login called for user " + user);
}
users = [ // by last name since we have too many Pauls.
    'Irish',
    'Bakaus',
    'Kinlan'
];
users.forEach(function(element, index, array) {
    login(element);
});
login(users[0]);
What the sample code makes out:
Use the command line API
The command line is much more powerful than a simple log output directory. I t is also a full terminal prompt in the current web page. The command-line API has some of the following characteristics:
- A function that makes it easy to select DOM elements
- A function used to control CPU detection
- Some console APIs are anonymous methods
- Monitor events
- Register an object to monitor view events
The evaluation expression
When you
Enter
the console evaluates any JavaScript expressions you provide. T
here are two ways to do this, one is fully automated and the other is to use tab. A
s soon as you enter an expression, you'll be prompted for the name. I
f there are more than one matching
↑
↓
to loop between them. P
ressing
→
the current option.
If there is only one option, pressing
Tab
selects the current option.
 Some sample expressions are displayed in the console
Select the element
There are some shortcuts for selecting elements. These shortcuts save you a lot of time compared to the usual way to use them.
| $() | Returns the first element that matches the CSS selector. This is also a shortcut to document.quertSelector(). |
|---|---|
| $$() | Returns an array that contains all matching CSS selectors. This is an alias for document.querySelectorAll(). |
| $x() | Returns an array that matches a specific XPath |
Examples of target selection:
$('code') // Returns the first code element in the document.
$$('figure') // Returns an array of all figure elements in the document.
$x('html/body/p') // Returns an array of all paragraphs in the document body.
Check the DOM elements and JavaScript heap objects
The inspect() function can make a DOM element or JavaScript reference as an argument. I f you provide a DOM element, the developer tool jumps to the element panel and displays that element. If you provide a JavaScript reference, you'll be taken to the Overview panel.
When this code is executed on your page, it grabs the number and displays it in the element panel. This is an expression that takes the advantage of the $?property to estimate this output.
$('[data-target="inspecting-dom-elements-example"]')
inspect($_)
Use recently selected elements and objects
The console stores the last 5 elements and objects. O nce you select an element in the element panel, or an object in the overview panel, it is recorded in the history stack. ides an entry point into the history stack. N ote that the computer counts from 0. This means that $0 is selected first and $4 is selected last.
Listen for events
The monitorEvents() method lets developer tools log information about specific targets. T he first argument is the listening object. I f the second argument does not provide a parameter, all events are returned. To specify the events you want to listen to, you need to provide a string or an array of strings as the second argument.
Listen for click time on the body of the page.
monitorEvents(document.body, "click");If an event type supported by the developer tool maps to a standard event name, the time of that type is monitored. The console API has a complete mapping from event to event type.
Stop listening to the body object, you can call the unmonitorEvents() method and tell it to stop listening to the object.
Stop listening to the body object
unmonitorEvents(document.body);Controls CPU detection
The profile() function turns on JavaScript CPU detection. Y ou can also name the detection by entering a string. To stop detection, call the profileEnd() method.
Create an unnamed detection.
profile()
profileEnd()
Example detection:
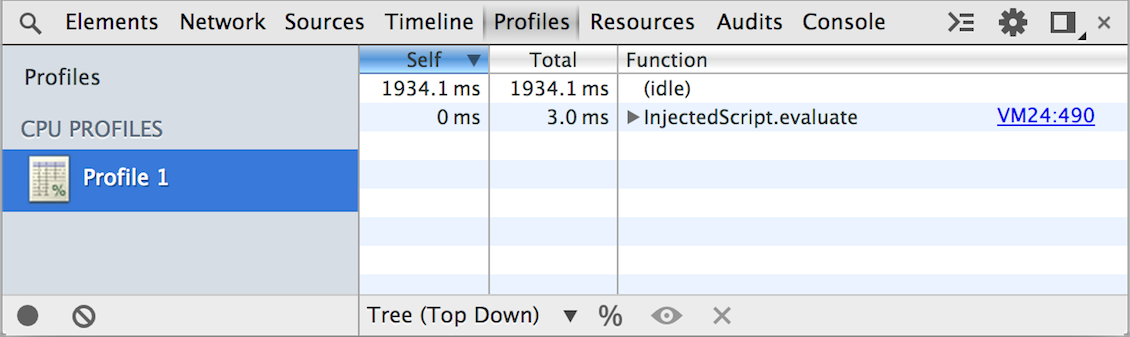
If you provide a label, the label will be treated as a title. If you create multiple profiles and they use the same label, they will be assered to a unified group.
Example code:
profile("init")
profileEnd("init")
profile("init")
profileEnd("init")
Results on the configuration panel:
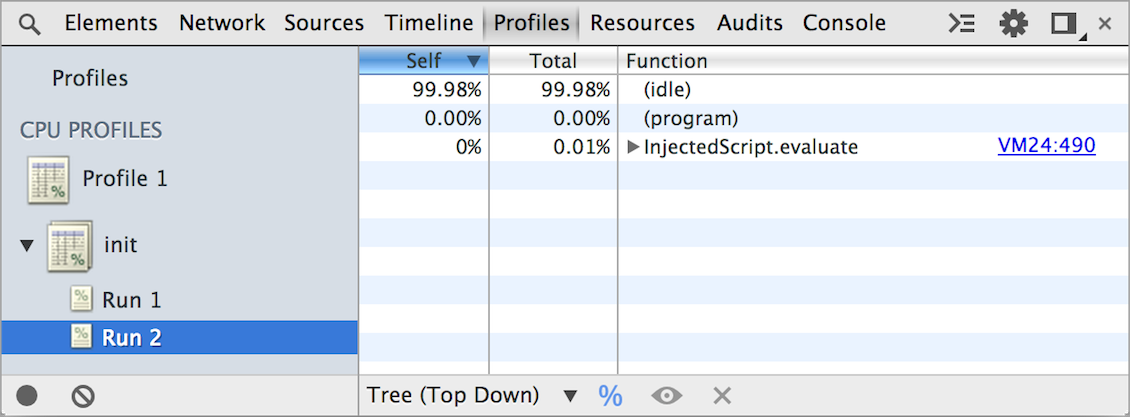
Multiple CPU profiles can be operated at the same time. Also, you don't need to close them in the order in which they were created.
Close statements nested in the same order:
profile("A")
profile("B")
profileEnd("A")
profileEnd("B")
Closed statements nested in alternating order:
profile("A")
profile("B")
profileEnd("B")
profileEnd("A")
Set up
You can modify four console settings in the general tab in the developer tool's settings window.
| Hide network message | Let the console not output log information about network problems. For example, problems with the 404 and 500 series will not be logged. |
|---|---|
| Log XMLHTTPRequests | Decides whether the console wants to record each XMLHttpRequest. |
| Preserve log upon navigation | Decides whether the console history should be deleted when navigating to another page |
| Show timestamps | If a statement calls the console, this option displays the timestamp for each call. This also invalidates message stacking |
Summarize
Chrome Developer Tools provides a powerful console. B y now you should already know how to start using this tool to store information and get elements. The utility of this tool gives you unlimited possibilities, and as a cornerstone, you can build your web paradise.