Chrome Development Tool Extension DevTools
May 26, 2021 Chrome A guide to developing tools
Table of contents
5. DevTools interface elements: Panels and sidebar panes
Extend DevTools
Overview
A DevTools plug-in can add functionality to Chrome DevTools. I t adds new UI panels and sidebars, communicates with the page being checked, gets information about network requests, and other features. S ee the explicit DevTools plug-in. The DevTools plug-in has access to an additional set of specific DevTools extension APIs:
A DevTools plug-in is structured like any other plug-in: it can have a background page, content scripts, and other principals. In addition, each DevTools plug-in has a DevTools page with access to its DevTools API.
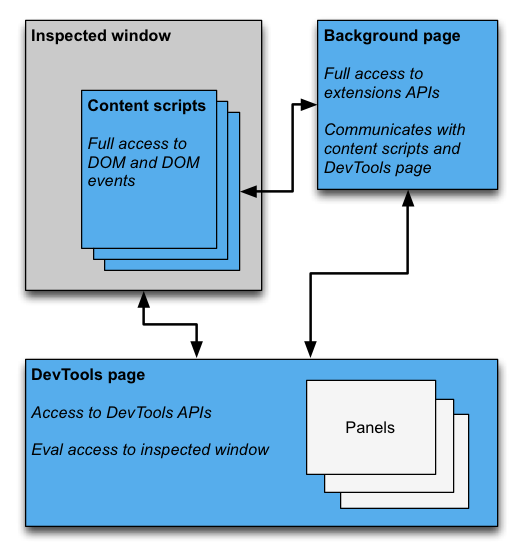
DevTools page
An instance of a plug-in DevTools page is created each time the DevTools window opens. T he DevTools page is in memory during the DevTools window lifecycle. T he DevTools page has access to the DevTools API and a limited set of extension APIs. Specifically, the DevTools page can:
- Create and interact with panels with devtools.panels.
- Get information about the check window and test the code using the devtools.inspectedWindow API in the check window.
- Get it using the devtools.network API.
DevTools pages do not use most extension APIs directly. I t can access a subset of the APIs that are extended and running because the content scripts of those APIs can be accessed. Like a content script, a DevTools page can interact with a background page using Message Passing, as detailed in The Injection Content Script Message Passing.
Create a DevTools plug-in
Create a DevTools page for your plug-in and add a domain to the
devtools_page
file:
{
  "name": ...
  "version": "1.0",
  "minimum_chrome_version": "10.0",
  "devtools_page": "devtools.html",
  ...
}
When each DevTools window is opened, instances of
devtools_page
in the plug-in manifest are created.
The page can
use the devtools.panels API to
add pages from other extensions as panels and sidebars to the DevTools window.
devtools_page domain must point to an HTML page. This is
backgroundthe background domain,backgroundis used to specify a specific background page and allows you to specify JavaScript files directly.
chrome.develop.*
T
he API model can only be used on pages that are loaded into the DevTools window. C
ontent scripts and other extension pages do not have these APIs.
Therefore, these APIs are only available during the DevTools window lifecycle.
There are also some DevTools APIs that are still in a test state. See the chrome.test.? API, which gives examples of APIs for testing and guidance on how to use them.
DevTools interface elements: Panels and sidebar panes
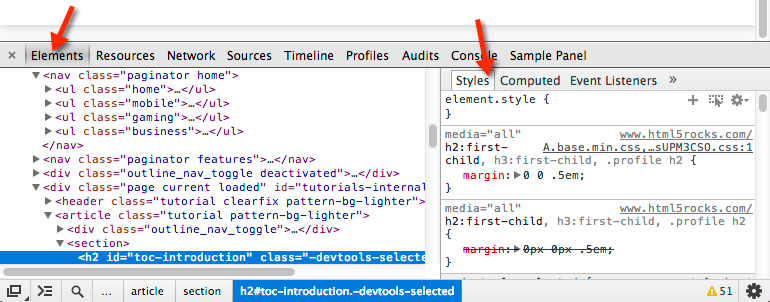
In addition to commonly used extension UI elements such as browser behavior, text menus, and pop-ups, a DevTools plug-in can add UI elements to the DevTools window:
- A panel is a top-level label, like elements, sources, and network boards.
- Sidebar panes display panels that complement the UI. I nherent styles, styles set, and event listener panes on element panels are examples of sidebar panes. C urrently, your plug-in can only add sidebar panes to the Elements panel. ( Note that the appearance of the sidebar panel may not match the image, depending on the version you're using Chrome and where the DevTools window docks.) )
Each panel is its own HTML file and can include other resources (JavaScript, CSS, pictures, and so on). Create a basic panel like this:
chrome.devtools.panels.create("My Panel",
    "MyPanelIcon.png",
    "Panel.html",
    function(panel) {
      // code invoked on panel creation
    }
);
JavaScript objects executed on panels or in sidebar panes have access to the APIs that the DevTools page has access to.
Here's how to create a base side pane for the element panel, like this:
chrome.devtools.panels.elements.createSidebarPane("My Sidebar",
    function(sidebar) {
        // sidebar initialization code here
        sidebar.setObject({ some_data: "Some data to show" });
});
There are several ways to display the contents of a sidebar pane:
-
Take advantage of HTML documentation. Calling setPage specifies that an HTML page appears in the pane.
-
Take advantage of JSON data. Pass a JSON object to the setObject method.
- Take advantage of JavaScript expressions. P ass an expression to the setExpression method. DevTools performs an expression in the documentation of the page being examined and outputs the return value.
For both
setObject
setExpression
when they are entered into the DevTools console, the pane outputs the value, but
setExpression
can display DOM elements and any JavaScript object,
setObject
supports JSON objects.
Communication between plug-in components
The following sections describe some typical scenarios for communication between different components of the DevTools plug-in.
Inject script content
The DevTools page cannot call
tabs.executeScript directly.
I
n order to inject content scripts from the DevTools page, you must retrieve the ID of the check window tab using
inspectedWindow.tabId
property and send a message to the background page.
On the background page, call
tabs.executeScript injection
script.
If the content script has been injected, you can use
eval
method to add additional content scripts.
See
Passing the selected element as a content script for
more information.
The following snippet shows how to inject a script with
executeScript
// DevTools page -- devtools.js
// Create a connection to the background page
var backgroundPageConnection = chrome.runtime.connect({
    name: "devtools-page"
});
backgroundPageConnection.onMessage.addListener(function (message) {
    // Handle responses from the background page, if any
});
// Relay the tab ID to the background page
chrome.runtime.sendMessage({
    tabId: chrome.devtools.inspectedWindow.tabId,
    scriptToInject: "content_script.js"
});
Code for the background page:
// Background page -- background.js
chrome.runtime.onConnect.addListener(function(devToolsConnection) {
    // assign the listener function to a variable so we can remove it later
    var devToolsListener = function(message, sender, sendResponse) {
        // Inject a content script into the identified tab
        chrome.tabs.executeScript(message.tabId,
            { file: message.scriptToInject });
    }
    // add the listener
    devToolsConnection.onMessage.addListener(devToolsListener);
    devToolsConnection.onDisconnect(function() {
         devToolsConnection.onMessage.removeListener(devToolsListener);
    });
}
Test JavaScript code in the check window
You can use
the inspectedWindow.eval method
to execute JavaScript code in the context of the check page.
You can then call the eval method in the DevTools page, panel, or
eval
By default, expressions are evaluated in the main frame document of the page.
By now, you may be familiar with The DevTools command
line API (commandline API) features
like element check
inspect(elem)
function
debug(fn)
copying content
copy()
and perhaps more.
inspectedWindow.eval()
context to enter code in the options of the DevTools console, which allows access to these APIs within the scope of the test.
For example,
SOAK
uses it to detect an element:
    chrome.devtools.inspectedWindow.eval(
      "inspect($$('head script[data-soak=main]')[0])",
      function(result, isException) { }
    );
Alternatively, use the
useContentScriptContext
option from
inspectedWindow.eval()
to evaluate expressions in the same context as the content script.
Calling
eval
in the
useContentScriptContext:true
domain does not create an environment for
evel
script before calling evel, or call the execution script by specifying the content script in the manifest.json
executeScript
Once the context script content environment exists, you can use this option to inject additional content scripts.
evalmethod is powerful when it is used in the right application scenario, but it is also dangerous if not used correctly. I f you don't need to get javaScript content to check the page, use the tabs.executeScript method. For detailed considerations and a comparison of the two methods, see inspectedWindow.
Pass the selected element to the content script
The content script does not have direct access to the currently selected element. H
owever, any
code executed using inspectedWindow.eval
can be used in the DevTools console and command line APIs.
For example, when you test your code, you can
$0
to access the currently selected element.
To pass the selected element to the content script, you can do this as follows:
- In the content script, create a function with the selected argument as the argument to the function.
-
The function method is used in the DevTools page in
inspectedWindow.evaluseContentScriptContext:true
Your function code might look like this in a content script:
function setSelectedElement(el) {
    // do something with the selected element
}
Call this method on the DevTools page, like this:
chrome.devtools.inspectedWindow.eval("setSelectedElement($0)",
    { useContentScriptContext: true });
useContentScriptContext:true
the expression to the content script that must be in the same context, so it can
setSelectedElement
method.
Get a reference board window
From the devtools panel
postMessage
you need a reference to its
window
object.
Get the panel's iframe window from
the panel.onShown
event handler;
onShown.addListener(function callback)
extensionPanel.onShown.addListener(function (extPanelWindow) {
    extPanelWindow instanceof Window; // true
    extPanelWindow.postMessage( // …
});
Pass information from the content script to the DevTools page
Delivering a message between a DevTools page and a content script is not direct, but through a background page.
When a message is sent to a content script, the background page can use the tabs.sendMessage method, which sends a message to the content script in a specified tab, as if to inject a content script.
When a message is sent from a content script, there is no out-of-the-way way to deliver the message to an instance of the exact DevTools page associated with the current tab. As a workable approach, you can have the DevTools page establish a long lifecycle connection to the background page and have the background page hold the ID tab to the connection map so that it can route each message to the correct connection.
// background.js
var connections = {};
chrome.runtime.onConnect.addListener(function (port) {
    var extensionListener = function (message, sender, sendResponse) {
        // The original connection event doesn't include the tab ID of the
        // DevTools page, so we need to send it explicitly.
        if (message.name == "init") {
          connections[message.tabId] = port;
          return;
        }
    // other message handling
    }
    // Listen to messages sent from the DevTools page
    port.onMessage.addListener(extensionListener);
    port.onDisconnect.addListener(function(port) {
        port.onMessage.removeListener(extensionListener);
        var tabs = Object.keys(connections);
        for (var i=0, len=tabs.length; i < len; i++) {
          if (connections[tabs[i]] == port) {
            delete connections[tabs[i]]
            break;
          }
        }
    });
});
// Receive message from content script and relay to the devTools page for the
// current tab
chrome.runtime.onMessage.addListener(function(request, sender, sendResponse) {
    // Messages from content scripts should have sender.tab set
    if (sender.tab) {
      var tabId = sender.tab.id;
      if (tabId in connections) {
        connections[tabId].postMessage(request);
      } else {
        console.log("Tab not found in connection list.");
      }
    } else {
      console.log("sender.tab not defined.");
    }
    return true;
});
The DevTools page (panel or sidebar pane) connects like this:
// Create a connection to the background page
var backgroundPageConnection = chrome.runtime.connect({
    name: "panel"
});
backgroundPageConnection.postMessage({
    name: 'init',
    tabId: chrome.devtools.inspectedWindow.tabId
});
Communication from the injection script to the DevTools page
Although the above solution applies to content scripts, direct injection of page code (for example, by
inspectedWindow.eval
requires a different strategy.
In this
runtime.sendMessage
not deliver messages to background scripts as expected.
As a work-through, you can combine content scripts with injection scripts. T
o deliver messages to content scripts, you can use API
window.postMessage
Here's an example, assuming that the background script is from the last section:
// injected-script.js
window.postMessage({
  greeting: 'hello there!',
  source: 'my-devtools-extension'
}, '*');
// content-script.js
window.addEventListener('message', function(event) {
// Only accept messages from the same frame
if (event.source !== window) {
return;
}
var message = event.data;
// Only accept messages that we know are ours
if (typeof message !== 'object' || message === null ||
!message.source === 'my-devtools-extension') {
return;
}
chrome.runtime.sendMessage(message);
});Your information will now be passed from the injection script, to the content script, then to the background script, and finally to the DevTools page.
You can also refer to two alternative messaging techniques here.
Detects The DevTools on and off status
If your plug-in needs to track whether the DevTools window is open, you can add an onConnect listener to the background page and call the connect method on the DevTools page. B ecause each label allows it to open its own DevTools window, you may receive events for multiple connections. To track when the DevTools window opens, you need to calculate connection and disconnect events, as follows:
// background.js
var openCount = 0;
chrome.runtime.onConnect.addListener(function (port) {
    if (port.name == "devtools-page") {
      if (openCount == 0) {
        alert("DevTools window opening.");
      }
      openCount++;
      port.onDisconnect.addListener(function(port) {
          openCount--;
          if (openCount == 0) {
            alert("Last DevTools window closing.");
          }
      });
    }
});
Make a connection on the DevTools page as follows:
// devtools.js

// Create a connection to the background page
var backgroundPageConnection = chrome.runtime.connect({
    name: "devtools-page"
});
An example of a DevTools plug-in
Browse these DevTools sample source code:
- Polymer Devtools Extension - Use many assistants running on the host page to query and get DOM/JS status and send it back to the custom panel.
- React DevTools Extension - Reuse devTools UI components using a sub-module of Bink.
- Ember Inspector - Share plug-in cores with adapters on Chrome and Firefox.
- Coquette-inspect - A clean rect-based plug-in, the debugger is injected into the host page.
- Our DevTools Extension Gallery and Sample Extensions are worth installing, trying out, and learning more from the app.