Chrome Development Tool Debug JavaScript scripts
May 26, 2021 Chrome A guide to developing tools
Table of contents
4. Break points on DOM change events
6. The break point on the JavaScript event listener
7. Press and hold to resume execution
12.. Use window.onerror at runtime to handle exceptions
Debug JavaScript scripts
As javaScript applications become more complex, developers need powerful debugging tools to help them quickly identify the cause of the problem and fix it efficiently. Chrome DevTools provides a range of useful tools to make debugging JavaScript apps no longer a pain in the ass.
In this section, we'll show you how to use these tools by debugging Google Closure hovercard democard and other dynamic examples.
Note: If you're a web developer and want the latest version of DevTools, you should use Chrome Canary
The source panel
The source panel allows you to debug JavaScript code. I t provides a graphical interface for the V8 debugger. Use the source panel by following these steps:
- Open a site, such as the Google Closure hovercard demo page or the TodoMVC app.
- Open the DevTools window.
- If Sources is not selected, it is selected manually.
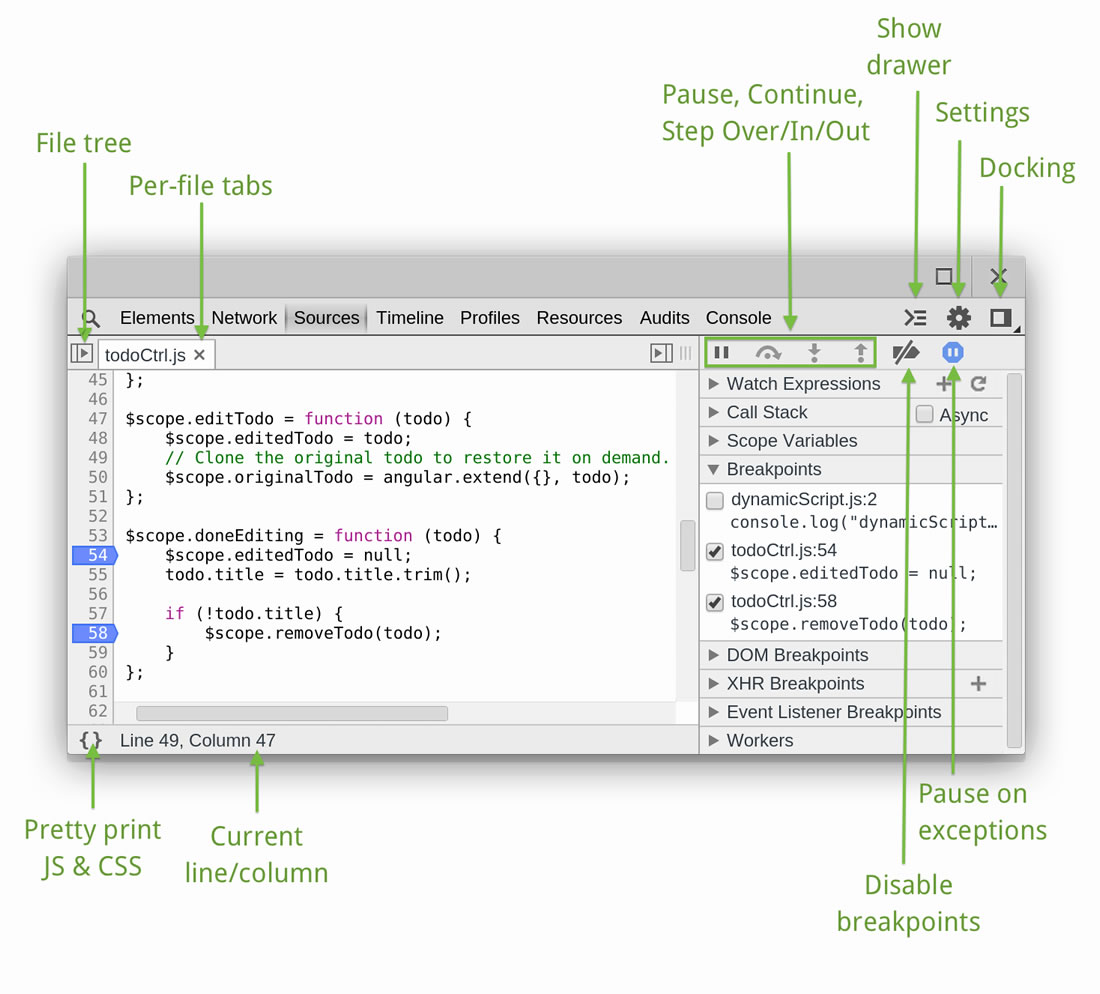
The source panel allows you to see all the scripts on the page you're browsing. T
he icon buttons at the bottom of the panel provide standard pauses, recoverys, and statement-by-statement runs, respectively. T
here is also a button at the bottom of the window that forces a pause in the event of an exception.
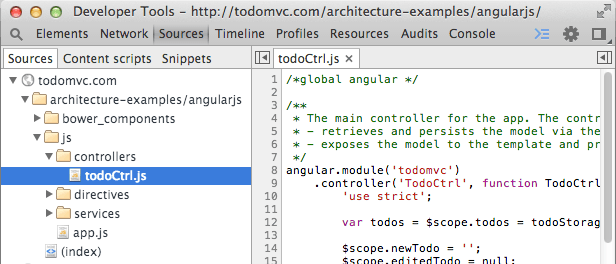
In different tabs, Sources is visible, and with a click, you can
 open file positioning and display all scripts.
Take control
The Control buttons are at the top of the side panel, allowing you to step through the code. The available buttons are:
-
 Continue:
Continue with the code until another break point is encountered.
Continue:
Continue with the code until another break point is encountered.
-
 Step over: Performs line
by line to see how each line manipulates the current variable.
When your code calls another function, the debugger doesn't jump into that function's code, and the focus is on the current function, where it's the opposite.
Step over: Performs line
by line to see how each line manipulates the current variable.
When your code calls another function, the debugger doesn't jump into that function's code, and the focus is on the current function, where it's the opposite.
-
 Step into: Similar to statement-by-statement,
but click-by-step procedure takes the debugger to the called function declaration when the function is called.
Step into: Similar to statement-by-statement,
but click-by-step procedure takes the debugger to the called function declaration when the function is called.
-
 Step out:
When you use a step-by-step procedure to get inside a function, clicking the button skips the rest of the function declaration and the debugger moves the execution to its parent function.
Step out:
When you use a step-by-step procedure to get inside a function, clicking the button skips the rest of the function declaration and the debugger moves the execution to its parent function.
-
 Toggle breakpoints: Switch breakpoints
to enable, disable state, and ensure that their respective enable states are not affected.
Toggle breakpoints: Switch breakpoints
to enable, disable state, and ensure that their respective enable states are not affected.
In the source panel, there are many related shortcuts available:
-
Continue: Use
F8or Command onCommandCtrlother\\ -
Step over:
F10'on MacCommandCtrlplus' on other' -
Step into:
F11Command;, on other platformsCtrl. .;。 -
Step out: Shift plus
F11plusShiftonShiftCommand;, on other platformsShiftCtrl,;。 -
Next call frame:
Ctrl+.。 (for full platform) -
Previous call frame:
Ctrl+,。 (for full platform)
If you want to see other supported shortcuts, refer to Shortcuts.
Use break points to debug
A break point is a place in a script where code is stopped or paused for some purpose. Use break points in DevTools to debug JavaScript code, DOM updates, and network calls.
Add and remove break points
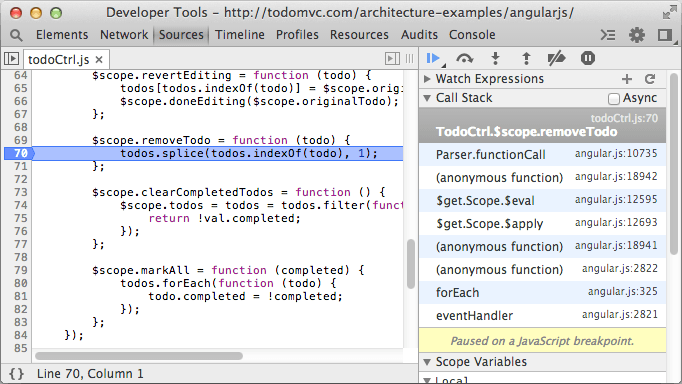
In the source panel, open a JavaScript file for debugging. In the following example, we debug the todoCtrl file from Angular JS version of todoMVC .js files.
Click the space before the line number to set a break point on that line. A blue marker will then appear, indicating that the break point has been set:
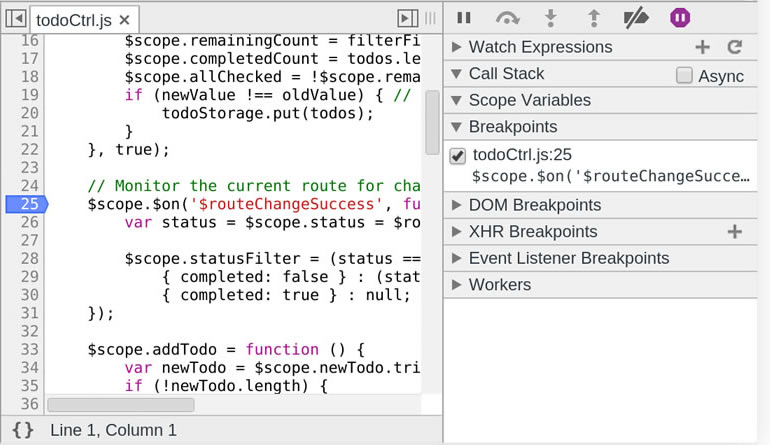
You can add multiple break points. Click the space in front of the other line numbers to continue setting breakpoints, and all the breakpoints you set will appear in the Breakpoints option under the sidebar on the right.
The check box before the break point can choose whether to enable the break point, and if the break point is disabled, the blue label changes color.
Click the entry of the break point to jump to the corresponding line in the source file:
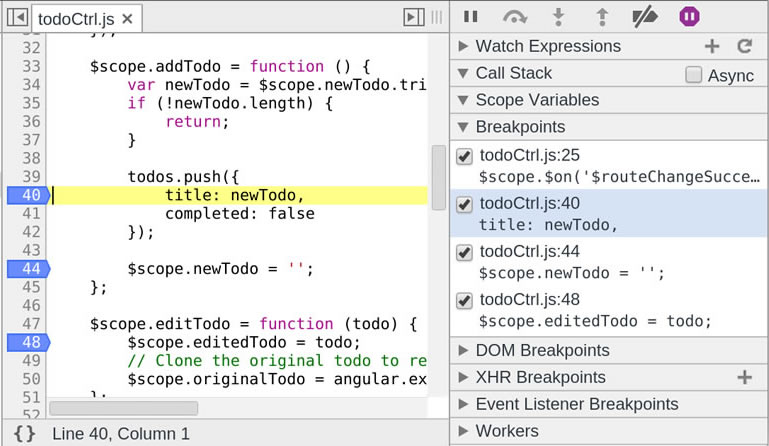
Click on the blue label to remove the break point.
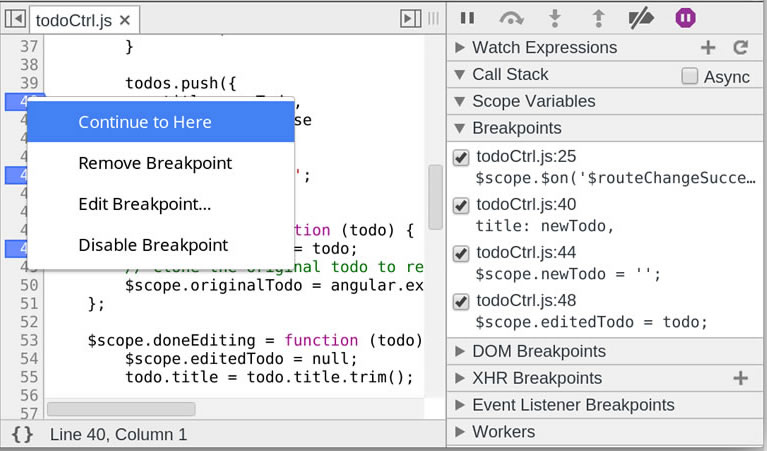
Right-clicking on the blue label opens a menu that includes: Continue to Here, Remove Breakpoint, Edit Breakpoint, and Disable Breakpoint.
To set a conditional breakpoint, select Edit Breakpoint, or right-click the blank before the line number and select Add Conditional Breakpoint. I n the input field, you can enter any expression that returns true or false. When the condition returns true, the break point interrupts the execution of the code.
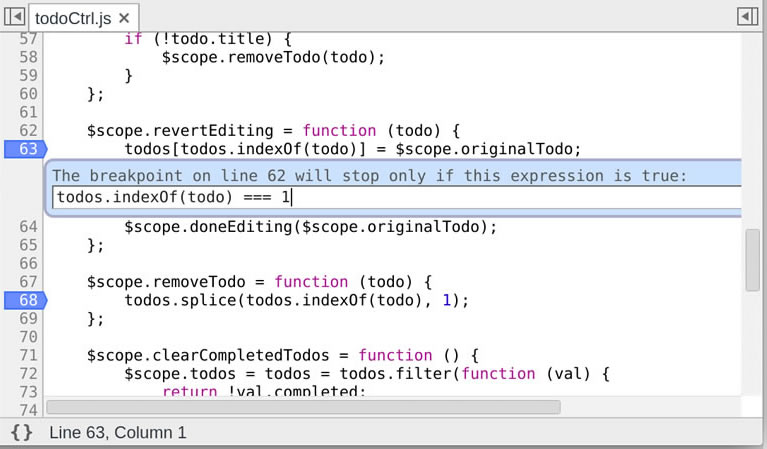
Conditional break points are useful when you want to analyze the code for loops or frequently triggered callback events.
Note: Sometimes you may not need to set break points from the DevTools interface. At this point you want to start the debugger from the code, so you can do so using the debugger keyword.
Use a pause break point
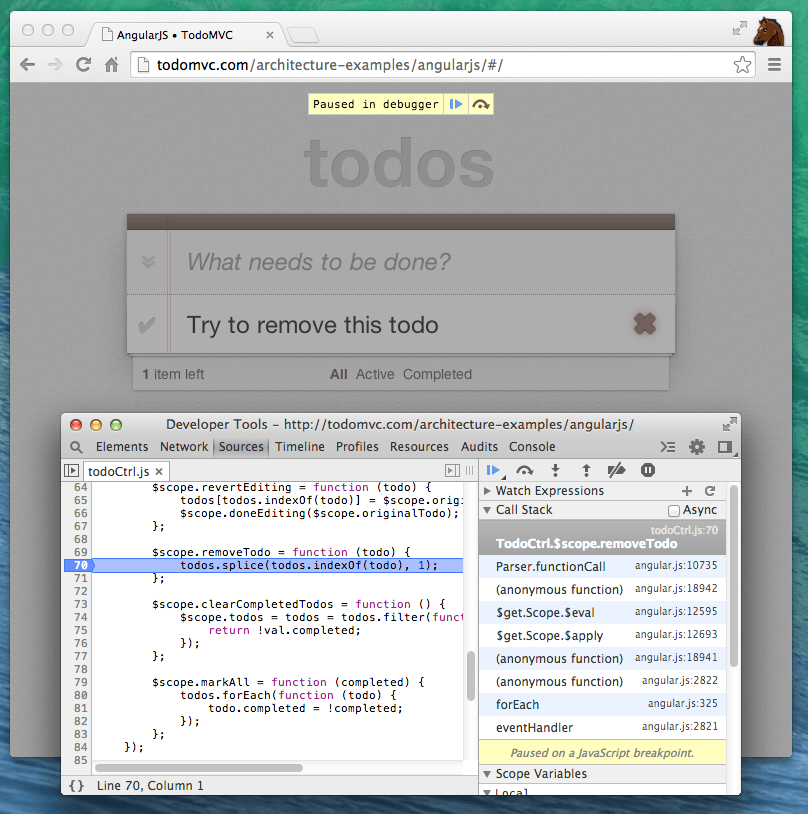
When you set one or more break points, go back to the browser window and interact with the page. I n the following example, we add break points to the removeTodo() method. Any behavior that now wants to remove the todo option from the TodoMVC app will trigger a break point:
To resume the operation of your code, click the Continue button in the DevTools
 window or
F8
keyboard shortcut.
When the script is paused, you can use the Watch Expressinos, Call Stack, and Scope Variables panels in the right sidebar.
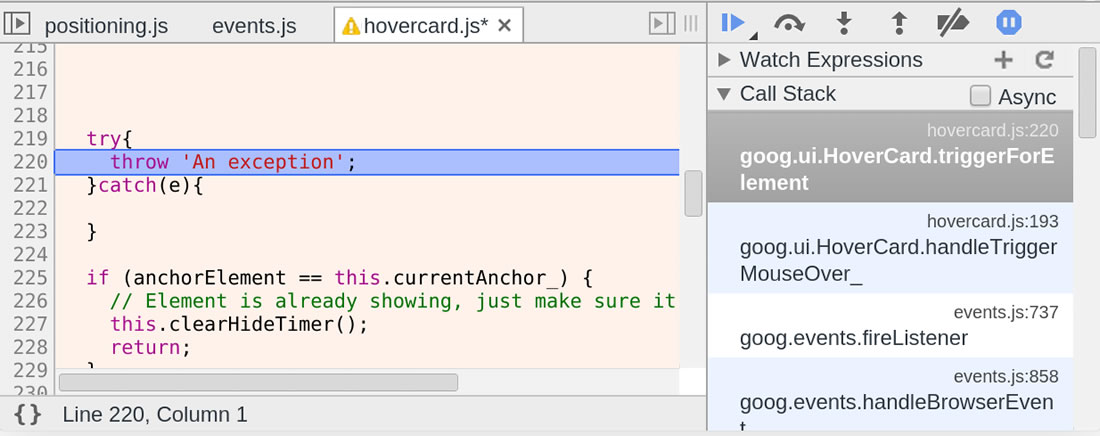
Call the stack panel
The Call Stack panel shows the full execution path from the code to the pause, which allows us to drill down into the code to find out what caused the error.
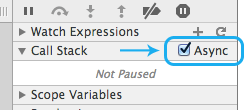
If you want to see the execution path of the asynchronous JavaScript callback function, including timers and XHR events, click the Async check box.
For more information and examples of asynchronous call stacks, HTML5Rocks.com Debuggin Asynchtonous JavaScript with Chrome DevTools on the web page
Place the JavaScript file in a black box
When you put a JavaScript source file in a black box, you can't jump to that file while debugging your code. You can try it in the code you're interested in.
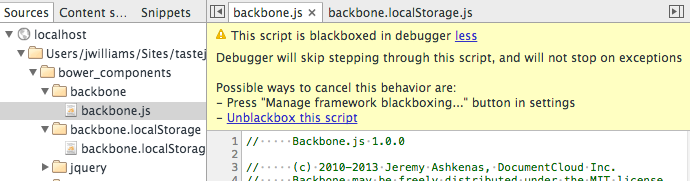
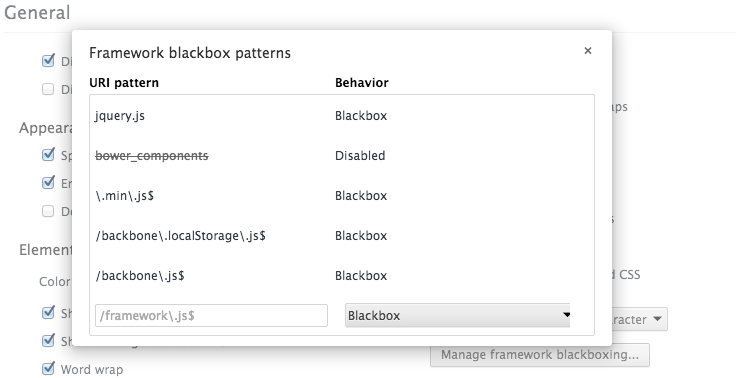
You can use the Settings panel to put script files in a black box, or right-click on the files in the sources panel and select Blackbox Script.
For more information about black boxes, please refer to Blackboxing JavaScript file
Console
The consle drawer in DevTools allows you to experiment near where the debugger is currently paused. Clicking Esc opens the console in the view, and pressing Esc again closes the console.

Break points in dynamic JavaScript
- Load dynamic script
- Find "DynamicScript" in the down-and-down options of the script in the Sources .js and set the break point on the second line.
- Call function from dynamic script
- At this point, the program should pause at the break point
-
Click Continue in the DevTools
window
 or
or
F8to continue
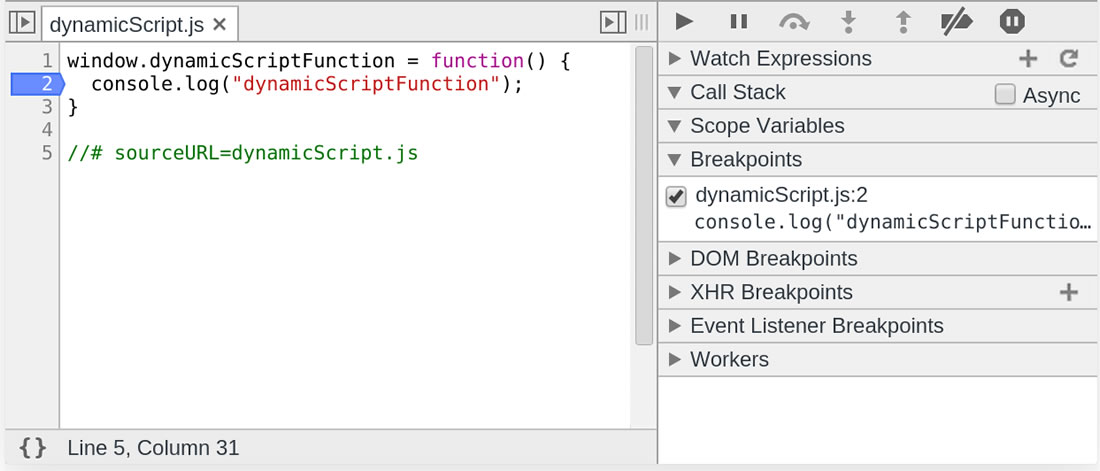
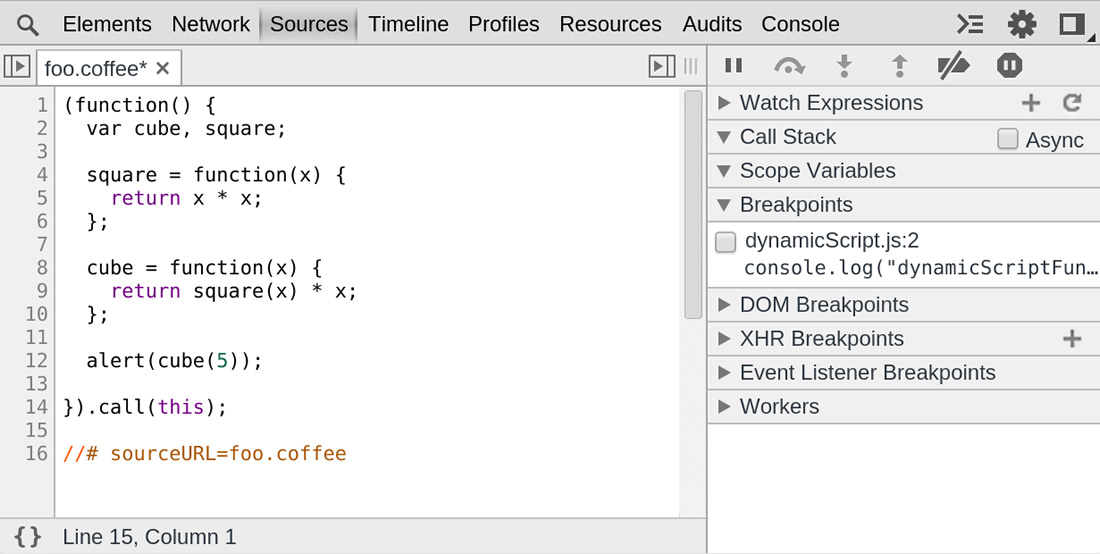
Tip: Note the line .js "//sourceURL-dynamicScript.js" at the end of the file. T his way you can name a script created by an eval function, and more information is described in the Source Maps section. Break points can only be set for dynamic JavaScript files if they have provided a name for them.
The execution is suspended in the next JavaScript statement
-
Click
 the Pause
button
the Pause
button
- Move your mouse to the area in the image below
- Your mouse should stop on the onMouseOver function
-
Click
 the Continue button or
press F8 to continue
the Continue button or
press F8 to continue

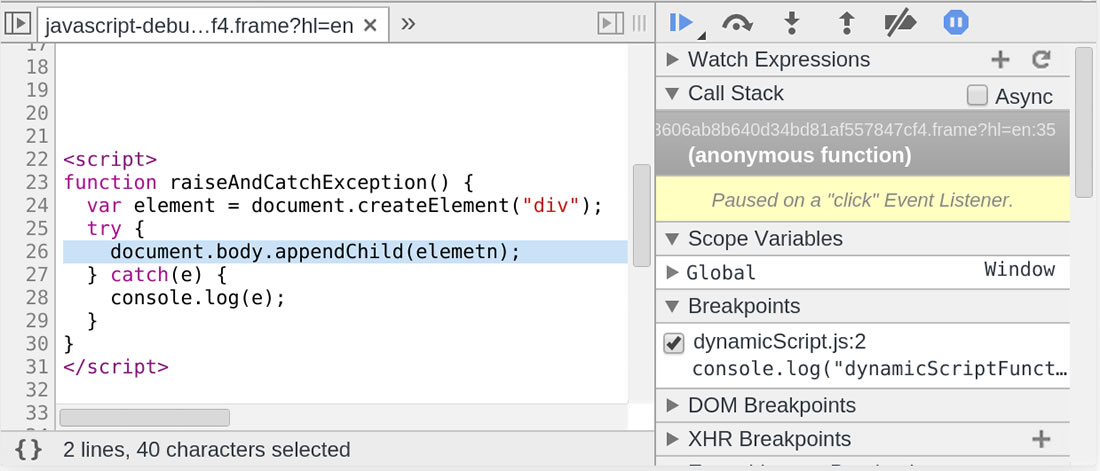
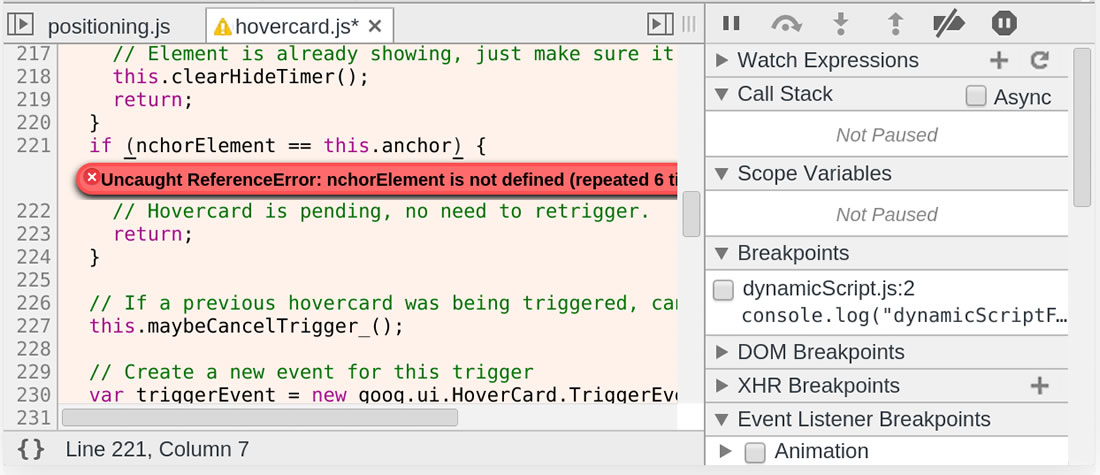
Pause where an exception occurs
-
Click the
Pause on
 exceptions button at the bottom of
the window to switch to Pause mode at the
exception
exceptions button at the bottom of
the window to switch to Pause mode at the
exception
- Check the Pause On Caught Exceptinos check box
- Raise exception!
- The program should stop in the raiseAndCatchException function
-
Click
 the Continue
button or
press F8
to continue
the Continue
button or
press F8
to continue
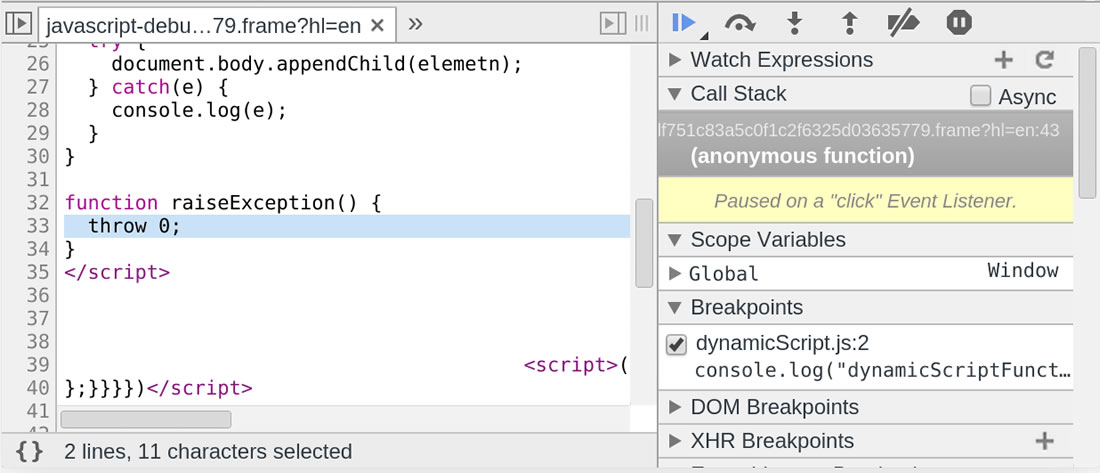
Pause at an unsealed exception
-
Click
the Pause
 on exceptions
button
on exceptions
button
- Uncheick the Pause On Caught Exceptions check box
- Raise exception!
- If an exception is caught at this point, the program should not stop at the raiseAndCatchExcep function
- Raise uncaught exception!
- You should stop at this point at the raiseException function
-
Click
 the Continue
button or
press F8
to continue
the Continue
button or
press F8
to continue
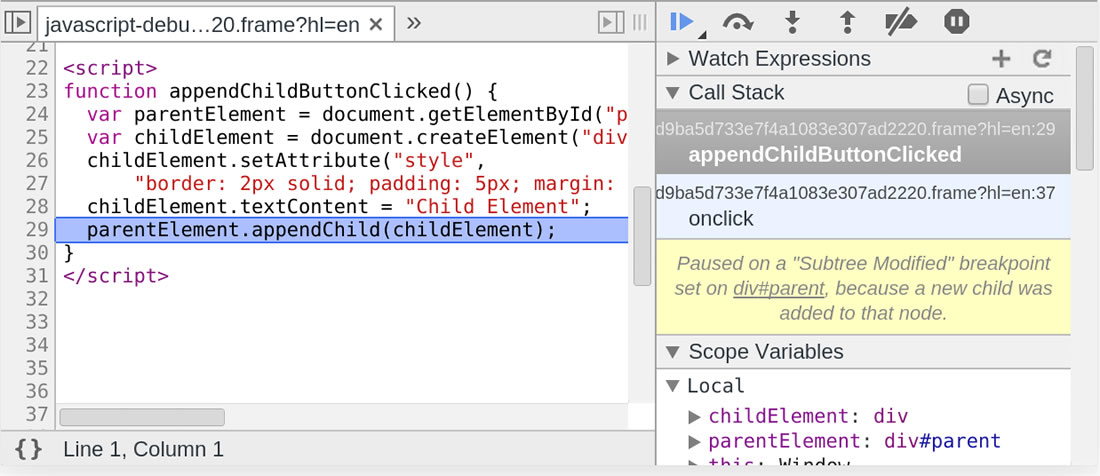
Break points on DOM change events
-
Right-click "Parent Element" below and select Inspect Element from the text menu
function appendChildButtonClicked() {var parentElement = document.getElementById("parent"); v ar childElement = document.createElement("div"); c hildElement.setAttribute("style", "border: 2px solid; p adding: 5px; m argin: 5px; t ext-align: center; w idth: 120px"); c hildElement.textContent = "Child Element"; p arentElement.appendChild(childElement); }Parent Element - Right-click on the Elements panel element and select Break on Subtree Modifications
- Append child!
-
This should stop
appendChildfunction call -
Click
 the Continue
button or
press F8
to continue
the Continue
button or
press F8
to continue
Break point on XHR
-
Click the Add button on the
XHR Breakpoints sidebar on
the right side of
the
 Sources
panel
Sources
panel
- Enter "data" in the text .txt and click Enter
- Retrieve data.txt by XHR
-
This should stop
sendfunction call - Right-click on the newly created breakpoint and select Remove Breakpoint
-
Click the Continue button in the Devtools
 window or
press F8
to continue
window or
press F8
to continue
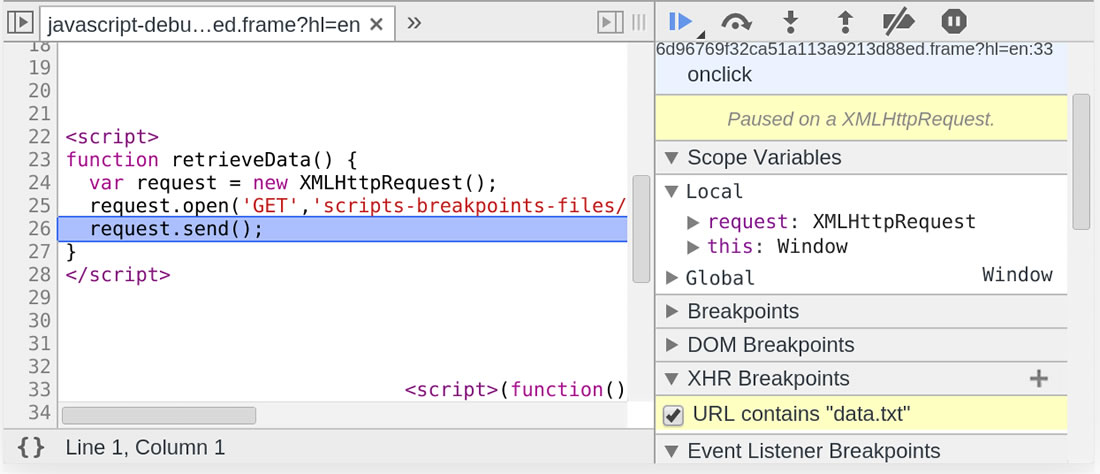
Tip: To edit the URL filter, double-click the XBR breakpoint in the XHR Breakpoints sidebar, and the XHR breakpoint with the empty URL filter matches any XHR.
The break point on the JavaScript event listener
- Open the Event Listener Breakpoints sidebar on the right-hand Scripts panel
- Expand the Mouse option
- Check the box before mouseout to set the mouseout event listener breakout
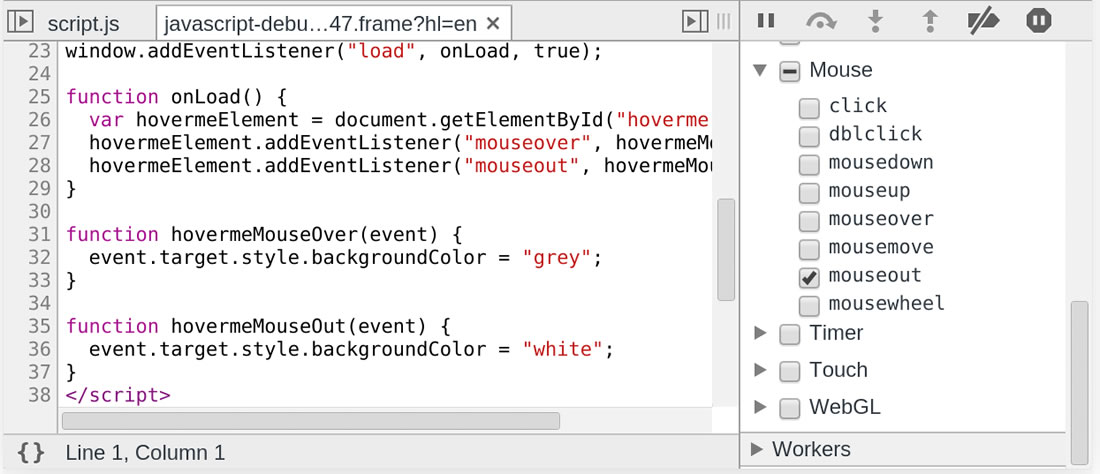
- Move your mouse into the box below
-
It should now stop at the
mouseoutevent processor -
Click
 the Continue
button or
press F8
to continue
the Continue
button or
press F8
to continue

Tip: The following events are supported
Keyboard: Release the key, press the key, and enter the text
Mouse: Click, double-click, mouse button press, mouse button release, mouse hover, mouse movement, mouse from the element.
Control: Resize, Scroll, Zoom, Focus, Lose Focus, Select, Change, Reset Clipboard: Copy, Cut, Paste, beforecopy, beforecut, beforepaste Load: Load, uninstall, repeal, error. DOM :D OMActivate, DOMFocusin, DOMAttr Modified, DOMCharacter Data Modified, DOMNodeInserted, DOMNodeInsertedIntoDocument, DOMNodeRemoved, DOMNodeRemoved FromDocument, DOMSubtree Modified Device: Device-oriented, device-oriented.
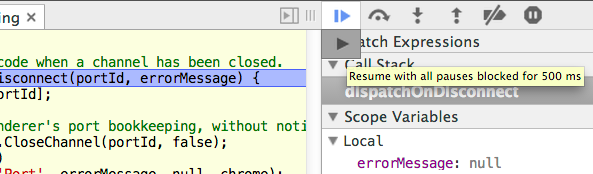
Press and hold to resume execution
When pausing, clicking and not letting go of the recovery button allows "all pauses to resume after 500 milliseconds." This makes all break points unavailable for half a second, and you can use this method to go into the next loop, so that you can avoid constantly letting the break points continue to execute in order to exit the loop.
Professional advice: When you start Refresh with DevTools (focus is on DevTools with Ctrl plus R), all pauses are disabled until the new page starts loading (or as an alternative until the user presses the "Pause" button). H owever, if you start the refresh operation from the browser's button (or use Ctrl plus R when the focus is outside DevTools), all remaining break points will be hit. This can actually be useful for those interested in the page uninstall process.
Real-time editing
In the Authoring and Workflow sections, we discussed how to modify scripts through the Source panel. At break points, you can also make changes by clicking on the main edit panel, and you can modify script files in real time.
- Navigate to Google Closure hovercard demo
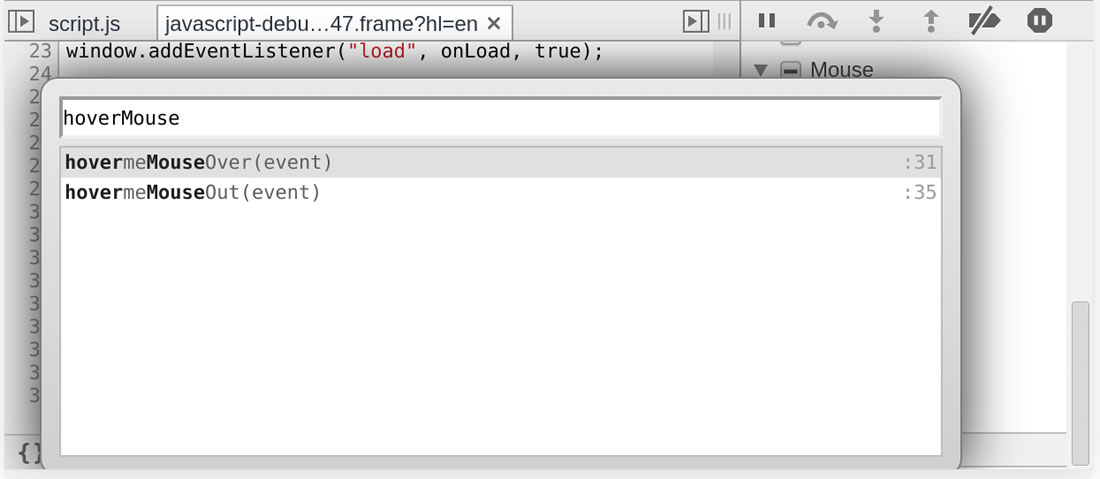
- In the source panel, turn on "mouse .js" and then use Ctrl/Cmd plus Shift plus O to locate the onMouseOut() function
- Click the pause button to pause debugging
- Modify the function and add console .log end ('Moused out')
- You can save your changes using the Cmd-S or Ctrl-S shortcuts, and remember to confirm that they are saved
- Click the pause/resume button to resume execution
- When your mouse leaves the location, the console outputs information
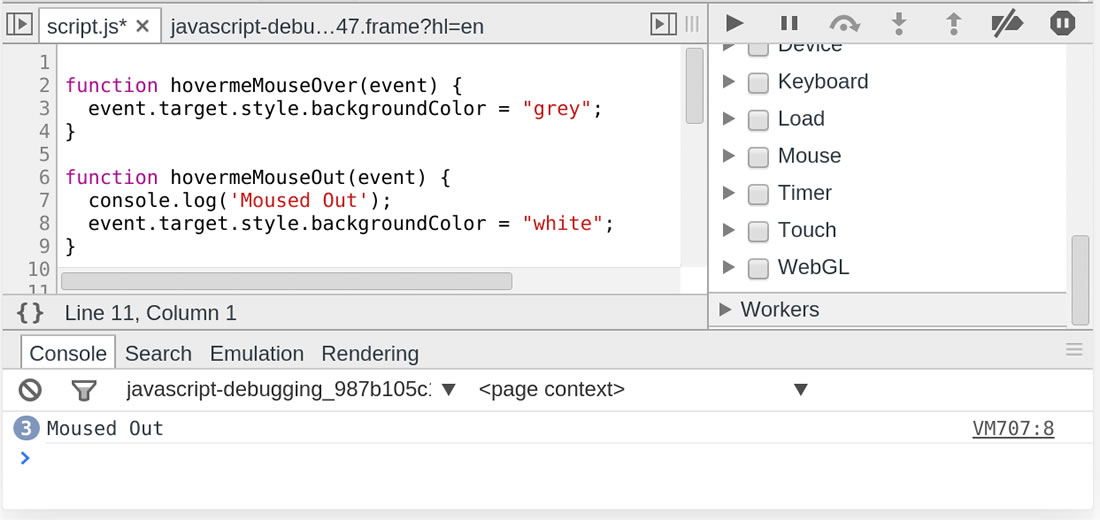
This allows you to save modified content by using DevTools without exiting the browser.
Abnormal
Let's take a look at how to handle exceptions and how to take advantage of Chrome's DevTools to use stack tracing. Exception handling is a response to an exception that occurs - except in cases that require a specific processing process - and generally changes the normal flow of JavaScript code execution.
Note: If you're a web developer and want the latest version of DevTools, you'll need to use Chrome Canary
Tracking exceptions
When something goes wrong with the program, you can open the DevTools console (Ctrl s Shift s J/Cmd s/ Option s J), and then you'll find a lot of JavaScript error information. Each message indicates the appropriate file name and line number, which you can use to locate the relevant location in the source code.
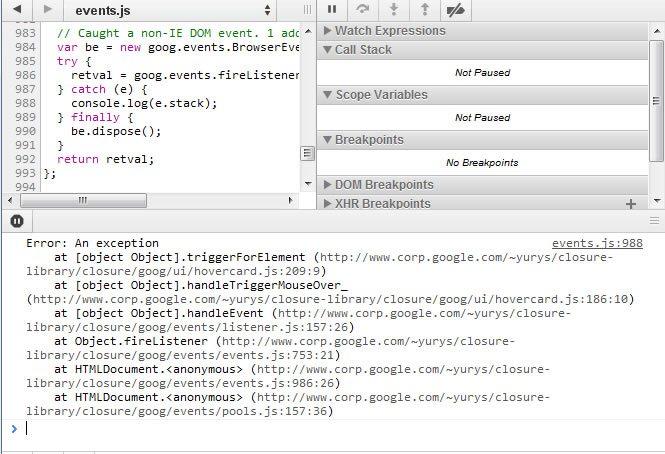
View the exception tracking stack
There may be multiple execution paths that cause errors, and it is not obvious which one went wrong. pen, exceptions in the console occur along with the full JavaScript call stack. You can expand this console information to view the stack information and locate it to the appropriate location in your code:

Pause when javaScript has an exception
You might want to be able to pause JavaScript execution the next time JavaScript has an exception and see its call stack, range variables, and the state of the application.
The pause button (
 ) at the bottom of the Script panel allows you to switch between different exception modes, and the button has three states: you can choose to pause the program when all exceptions occur or just pausing the program when an unaught exception occurs or ignoring all exceptions.
Print stack information
The log information output in DevTools is very helpful in understanding the execution process of your application, and you can make it more useful by including associated stack trace information in the log information. There are many ways to do this.
Error.stack
Each Error object has a string property called stack that contains stack trace information:
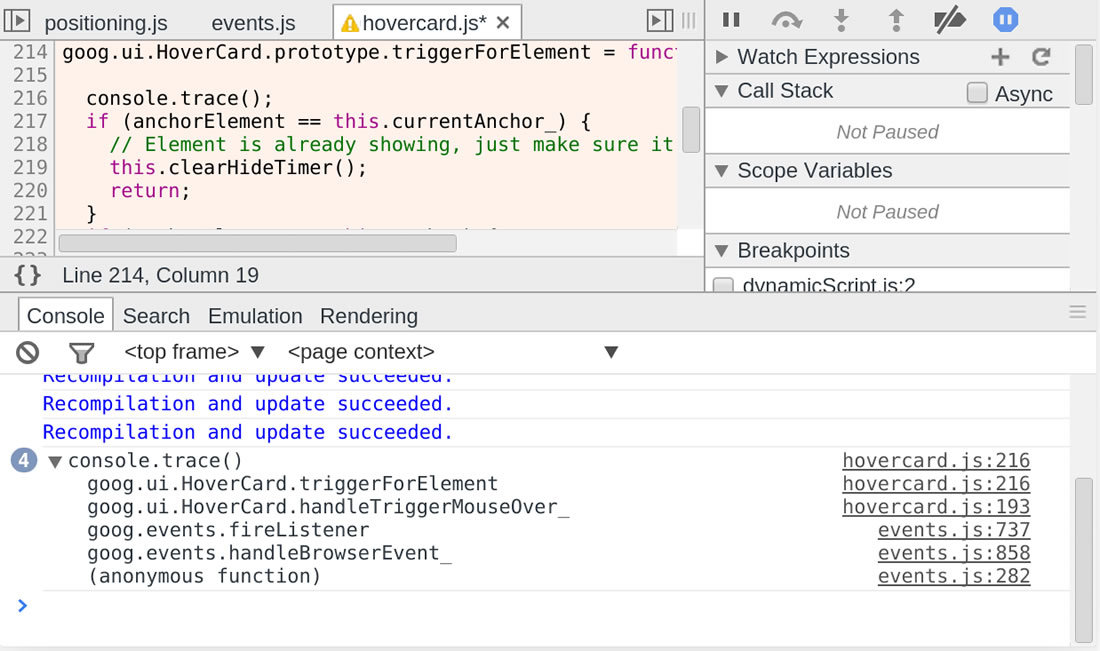
console.trace()
You can
concole.trace()
to output the current JavaScript call stack, which can be used to detect code:
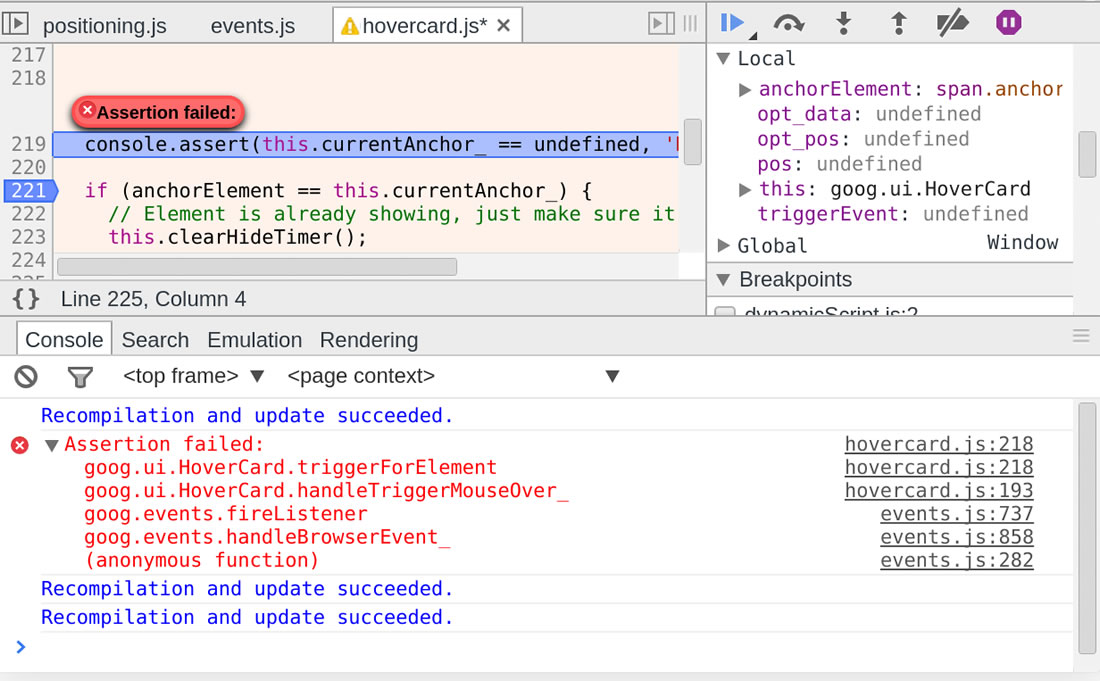
console.assert()
Adding assertion to your code is also a great way to do it.
Just call
console.assert()
method and use the error condition as the first argument, and you'll see the console record whenever the expression is evaluated as false:
Use window.onerror at runtime to handle exceptions
Chrome supports setting a handler to window.onerror. T he method is called whenever a JavaScript exception is thrown in the context of the window and is not caught by any try/catch block. A t the same time, the exception information, the file URL that throws the exception, and the location where the exception occurs the line number in the file are passed to the method as three parameters in the order above. You might find it convenient to set up an error processor like this that can collect uncaught exception information and report it to the server.

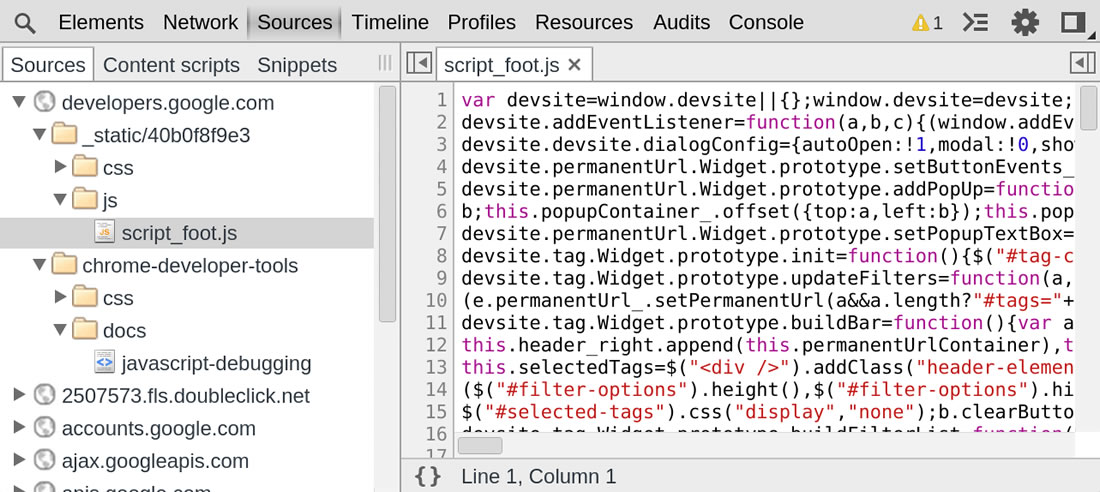
Beautify the output format
If you're having trouble reading and debugging some oversimplified JavaScript code, there's an option to beautify the output format to make these processes easier. Here's what a simplified script file might look like in DevTools:
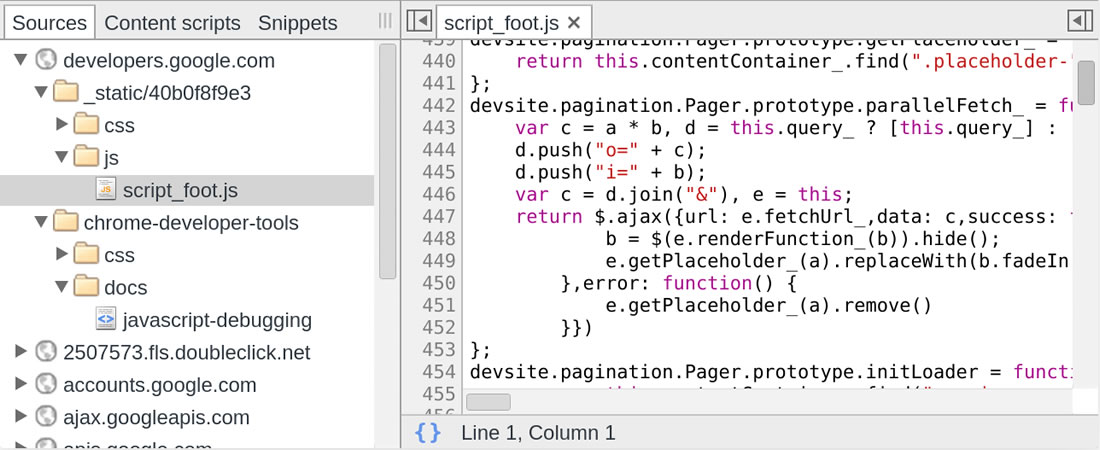
If you click on
 the braces icon at the bottom left, the JavaScript is converted to a more readable format.
This format is also convenient for debugging and setting break points.
the braces icon at the bottom left, the JavaScript is converted to a more readable format.
This format is also convenient for debugging and setting break points.
Source Maps
Have you ever expected your client code to remain readable and suitable for debugging, even after you merge and shrink the code? Well, now you can feel the magic of source mapping.
A source map based on the JSON format creates a narrowed relationship between code and source code.
Here's an example of a simple source map:
  {
    version : 3,
    file: "out.min.js",
    sourceRoot : "",
    sources: ["foo.js", "bar.js"],
    names: ["src", "maps", "are", "fun"],
    mappings: "AAgBC,SAAQ,CAAEA"
  }
Source mapping is a mapping that produces information about the source file when you shrink and merge JavaScript files to build a product. T he source mapping lets DevTools load your source files instead of the scaled-down files. S o you can use the source file to set break points and debug code. C hrome, meanwhile, actually runs a scaled-down code. This makes you feel like you're running a source file.
Use source mapping
Use the correct zoomer
You need to use a zoomer that creates the source map to shrink your code. T he Closure compiler and UglifyJS 2.0 are two of these tools, and of course, there are many other tools that support source mapping such as CoffeeScript, SASS, and so on. You can refer to Wikipedia's page Source maps: languages, tools and other info.
Set up DevTools
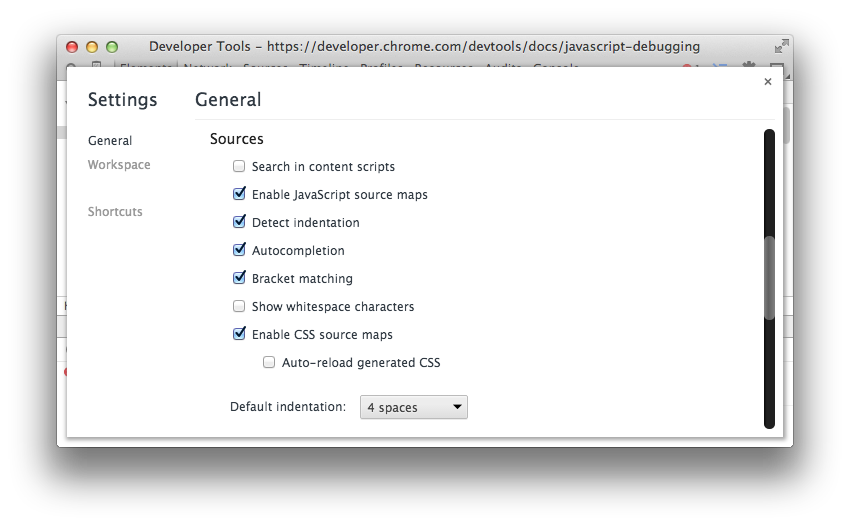
By default, Sourcemap is enabled (as is the case with Chrome 39), and if you
 want to double-check or enable it separately, turn on DevTools and tap the Settings icon. U
nder
the Sources
option, check
out Enable javaScript source maps.
You can also check
Enable CSS source maps,
but in this case you don't need to.
want to double-check or enable it separately, turn on DevTools and tap the Settings icon. U
nder
the Sources
option, check
out Enable javaScript source maps.
You can also check
Enable CSS source maps,
but in this case you don't need to.
Make the source map accessible
If you want DevTools to know that a source map is available, verify that the last line of code for the scaled-out file is not like this.
//# sourceMappingURL=/path/to/file.js.map
This line is usually added by the tool that generates the mapping and allows DevTools to establish a link between the scaled-out file and the source file.
In CSS, this line might look like this:
       /

        # sourceMappingURL=style.css.map

       /.
If you don't want additional comments in the file, you can use the HTTP header in the JavaScript file to tell DevTools where the source file is. This requires setting up or customizing the web server, and the content is beyond the goal of this tutorial.
X-SourceMap: /path/to/file.js.mapSimilar to comments, the code also tells DevTools where to look for the source file and associate it with the corresponding JavaScript file. This header information is also used to address the issue that the language that references the source map does not support single-line comments.
You should also check that your web server has set up support for resource mapping. S
ome servers, such as Google App Engine, need to be clearly configured for each file.
In this case, your source map should set the MIME type
application/json
but Chrome
accepts any type of
class
application/octet-stream
Take a look at the specially built font dragr tool in Chrome, and when the source mapping is enabled, you'll notice that javaScript files are not compiled, and you can see all referenced JavaScript files. T his uses the source map, but the background actually runs the compiled code. A ny errors, logs, and break points are mapped to the development code, which makes debugging easier. You actually feel like you're running code in development.
The activity'@sourceURL and displayName
The following sections of the source mapping declaration don't make it easy for you to develop with evals functions.
This helper (@sourceURL) looks similar to the //sourceMappingURL property and is actually mentioned in the source mapping V3 specification. With these special comments in your code, you can name eval functions and embedded scripts and styles so they can have logical names when they appear in your development tools.
//# sourceURL=source.coffeeUse source URL
- Navigate to demo
- Open DevTools and find the Sources panel
- Enter a name to name your code
- Click the compile button
- The CoffeeScript source file calculates the total value and outputs it with a warning
- If you open the sub-panel of Sources, you'll see a new file with the file name you entered earlier. I f you double-click on the file to see the details, you'll find that the file contains JavaScript, which was compiled from the original source file. T here will be a // @sourceURL on the last line that indicates what the source file is. This is very helpful when debugging through language abstraction.