Chrome Development Tool Command Line API Reference
May 26, 2021 Chrome A guide to developing tools
Table of contents
13.. getEventListeners(object)
16.. monitorEvents(object[, events])
Command line API reference
A collection of methods used by the Command Line API to perform common tasks with Chrome DevToos. T hese collections contain easy-to-use methods for selecting and examining DOM elements, stopping and starting analyzers, and monitoring DOM events. This API complements the Console API, which is only available within the console.
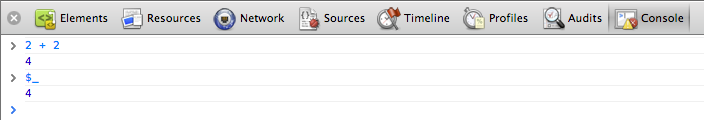
$_
Returns the value of the most recently evaluated expression. I n the following example is a simple expression evaluation. The $? property is evaluated and contains the same value as the expression:
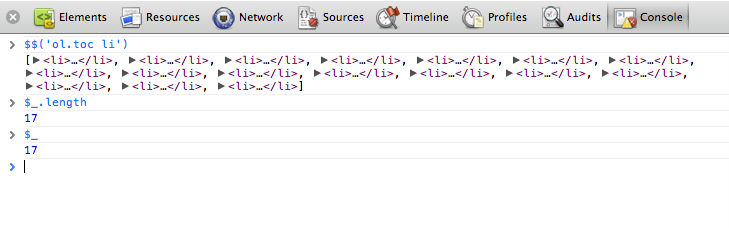
In the following example, the $$() method is called to evaluate an expression that returns a set of elements that match the CSS selector. This is followed by $ $.length evaluation to get the length of the array (17), which then becomes the last evaluation expression executed.
$0 - $4
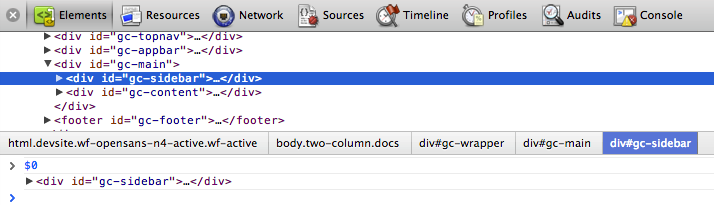
DevToos remembers the last 5 DOM elements (or JavaScript heap objects) that you have selected in this tab (or Profiles panel). G ive these available elements $0, $1, $2, $3, and $4. $0 returns the most recently selected element or JavaScript object, $1 returns a nearly selected object, and so on.
In the following example, the ID is an element of gc-sidebar that is selected in the Elemen tab. The calculation is performed in the console window $0, showing the same elements.
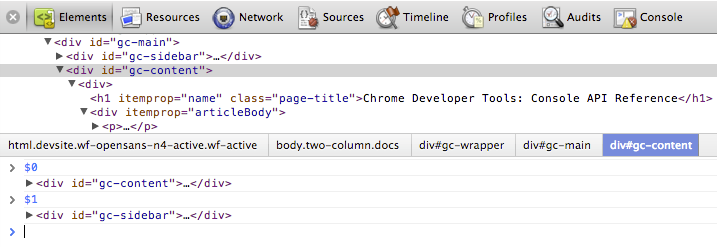
The following image shows the
gc-sidebar
element selected on the same page.
$0 now points to the newly selected element, and $1 now returns the previously selected element (gc-sidebar).
$(selector)
Use a specific CSS selector to return a reference to the first DOM element. T
his function is
document.querySelector()
function.
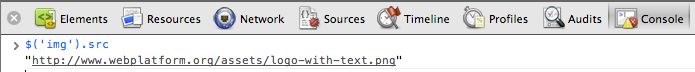
The following example saves a reference to the first img element in the document and calls to display its
src
$('img').src;
$$(selector)
Returns an array of elements that match a given CSS selector, which is equivalent
document.querySelectorAll()
method.
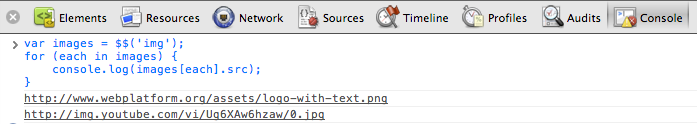
The following example uses
$$()
create an array of all img elements in the current document and output the
src
each element.
var images = $$('img');for (each in images) { images[each].src;}
注意:按 Shift+ 回车 在控制台输入一行新的脚本,但并立即执行。x(path)
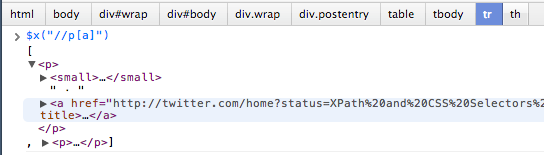
Returns an array of DOM elements that match a given XPath expression. For example, the following returns all p-label elements that contain a-tag elements:
$x("//p[a]");
clear()
Clear the history of the console
clear()Also seen in Clear console
copy(object)
Copy the characters of the specified object to represent to the clipboard
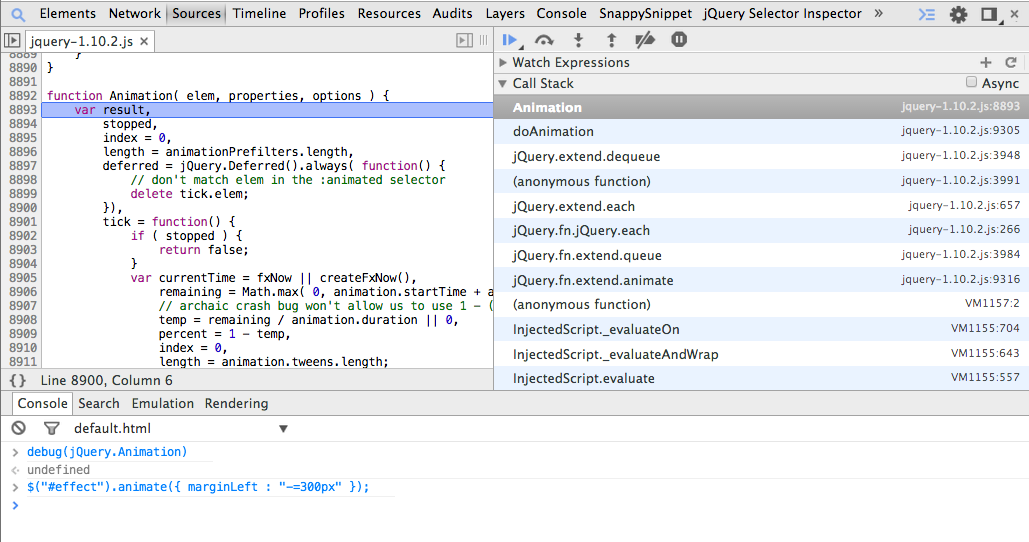
copydebuge(function)
When a function is specified to be called, the debugger debugs the function one by one in the source panel, allowing you to debug the code step by step.
debuge(getData);
 Use
undebug(fn) to
resume execution of the interrupt method, or use the UI interface to invalidate break points.
Use
undebug(fn) to
resume execution of the interrupt method, or use the UI interface to invalidate break points.
dir(object)
Outputs a list of object styles that specify all properties of an object.
This method is an
console.dir()
method.
The following example shows the difference between executing
document.body
the
dir()
method to display elements.
document.body;dir(document.body);
 For more information, see
console.dir() method of the Console
API.
For more information, see
console.dir() method of the Console
API.
dirxml(object)
Outputs the XML form of the specified object, as seen in the Elements
Elements tab
This method is equivalent to
console.dirxml()
method.
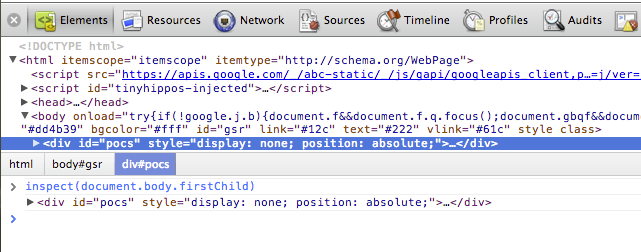
inspect(object/function)
Open and select the specified element or specified object in the appropriate panel: the Element panel for the DOM element or the Profiles panel for the JavaScript heap element.
The following example is the first child element
document.body
in the element panel;
inspect(document.body.firstChild);
When you pass a function as a check() argument, if the function is called, it opens it in the source panel for you to check.
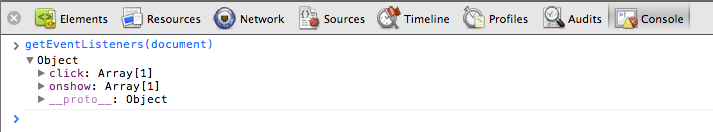
getEventListeners(object)
Returns the event listener registered on the specified object. T
he return value is an array object that contains
"click"
such as
"keydown"
T
he members of each array are objects that describe each type of registered listener.
For example, after the following command is executed, all
document
on the document object are listed.
getEventListeners(document);
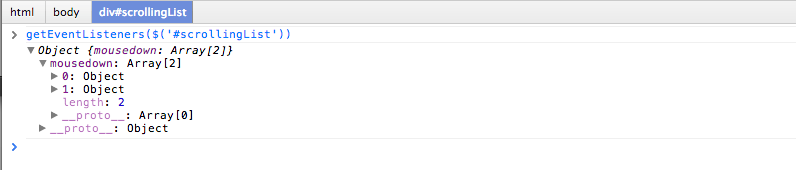
If more than one listener is registered in a specified object, the array contains each listener member.
For example, in the following example, two
#scrollingList
"mousedown" are registered in the #scrollingList element:
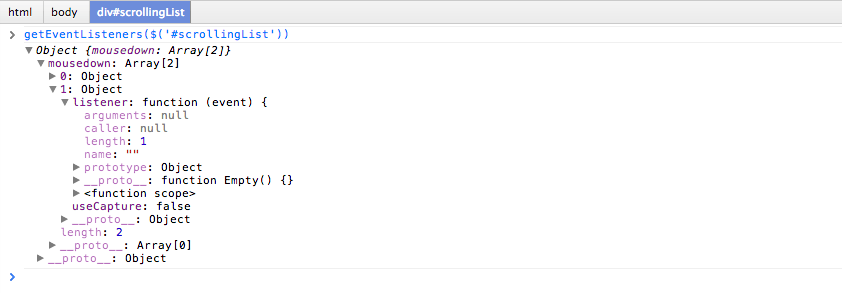
 You can further expand these objects to explore their properties:
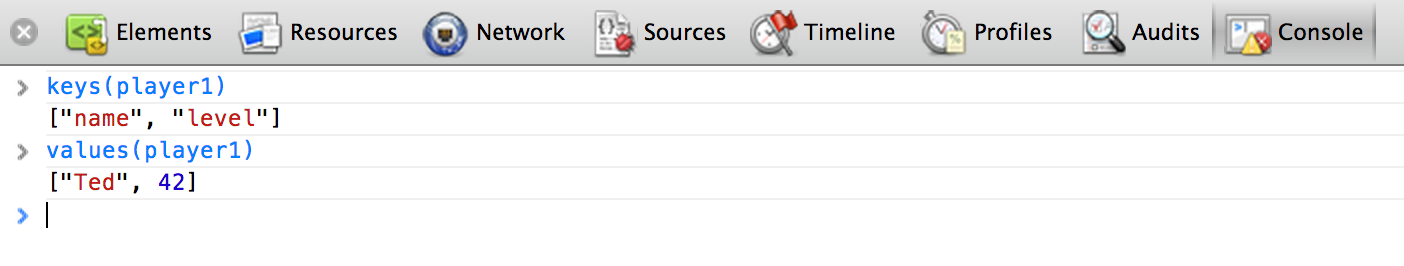
keys(object)
Returns an array that contains the name of the specified object property.
To get the value associated with the same property,
value()
For example, imagine that your program defines two objects:
var player1 = { "name": "Ted", "level": 42}
If player1 is defined in global space (for simplicity),
keys(player1)
and
values(player1)
the following output:
monitor(function)
When this method is called, a message is output to the console to represent the function name and the arguments passed in when the function is called.
function sum(x, y) { return x + y;}monitor(sum);
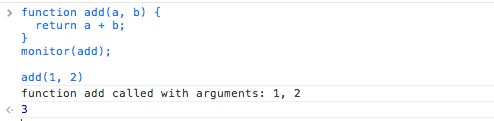
Use
unmonitor(function)
stop monitoring
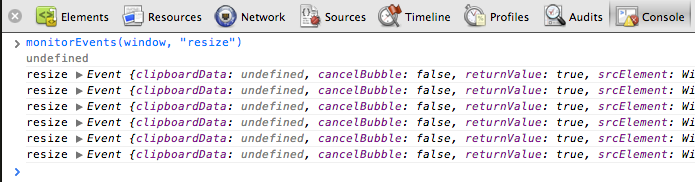
monitorEvents(object[, events])
When one of the specified events occurs on the specified object, the object for that event is output to the console. Y ou can specify a single event, to a monitor, an array of events, or to be mapped to one of the common event types, which maps to a predetermined collection of events. See the example below.
The following monitor monitors all
resize
object.
window
monitorEvents(window, "resize");
You can also specify an available event "types" that map to a predefined collection of events. The following table lists the types of events available and their associated event maps:
| The type of time | The corresponding mapping event |
|---|---|
| mouse | "click", "dblclick", "mousedown", "mouseeenter", "mouseleave", "mousemove", "mouseout", "mouseover", "mouseup", "mouseleave", "mousewheel" |
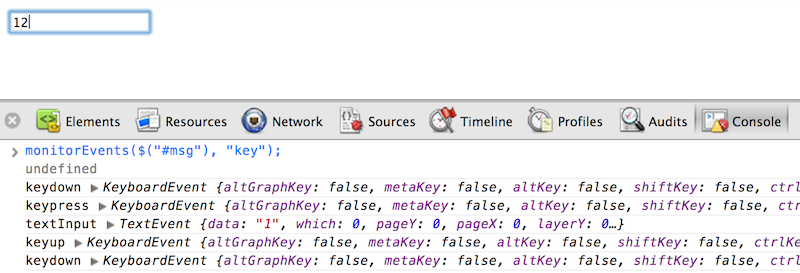
| key | "keydown", "keyup", "keypress", "textInput" |
| touch | "touchstart", "touchmove", "touchend", "touchcancel" |
| control | "resize", "scroll", "zoom", "focus", "blur", "select", "change", "submit", "reset" |
For example, the key event type corresponding to the input text field ("Key" event) is used #msg.
monitorEvents($("#msg"), "key");Here's an example of output after entering two characters in a text box:
profile([name])
Start a JavaScript CPU analysis session with the available file names. The profileEnd() method is called to complete the analysis.
To begin the analysis:
profile("My profile")Stop the analysis and display the results on the analysis panel:
profileEnd("My profile")Files can also be used nested, for example, under any command below.
profile('A');profile('B');profileEnd('A');profileEnd('B');For more examples, see Controlling the CPU profiler
profileEnd([name])
Stop the analysis session that you are currently starting with the profile() method and display the results on the configuration panel.
table(data[, columns])
Output object data as a table by passing in a data object with an optional column title. For example, output a list of names entered in the console as a table:
 var names = {    0: { firstName: "John", lastName: "Smith" },
 1: { firstName: "Jane", lastName: "Doe" }};table(names);
undebug(function)
Stop debugging the specified function so that when the method is called is no longer called.
undebug(getData);unmonitor(function)
Stop monitoring the specified method, as compared to monitor(fn).
unmonitorEvents(object[, events])
Stop monitoring events for specified objects and specified events. For example, stop all event monitoring on the window object below:
unmonitorEvents(window);You can also selectively stop monitoring of specified events on objects. For example, the following code starts monitoring all mouse events on the currently selected element, and then stops monitoring "mousemove" events (perhaps to reduce noise in the console output).
monitorEvents($0, "mouse");unmonitorEvents($0, "mousemove");See monitoring events .
values(object)
Returns an array that contains all the property values of the specified object.
values(object);Other APIs
Chrome extensions can inject additional secondary methods into the command line API. For example, Debug Utils extension (github) provides methods for retrieving break points in property access, event lifting, and method calls.