Chrome Development Tool analyzes JavaScript performance
May 26, 2021 Chrome A guide to developing tools
Table of contents
Analyze JavaScript performance
An overview of JavaScript analysis
Use Google Chrome to open the V8 Benchmark Kit page. T hen open Chrome DevTools, navigate to the profile panel, and verify that Collect JavaScript CPU Profile is selected. N ow, click the Start button or press Cmd plus E to start recording a JavaScript CPU profile. Then refresh the V8 base suite page.
When the page is overloaded, the score for the benchmark is displayed. Back to DevTools, click the stop button or press the Cmd plus E stop record again.
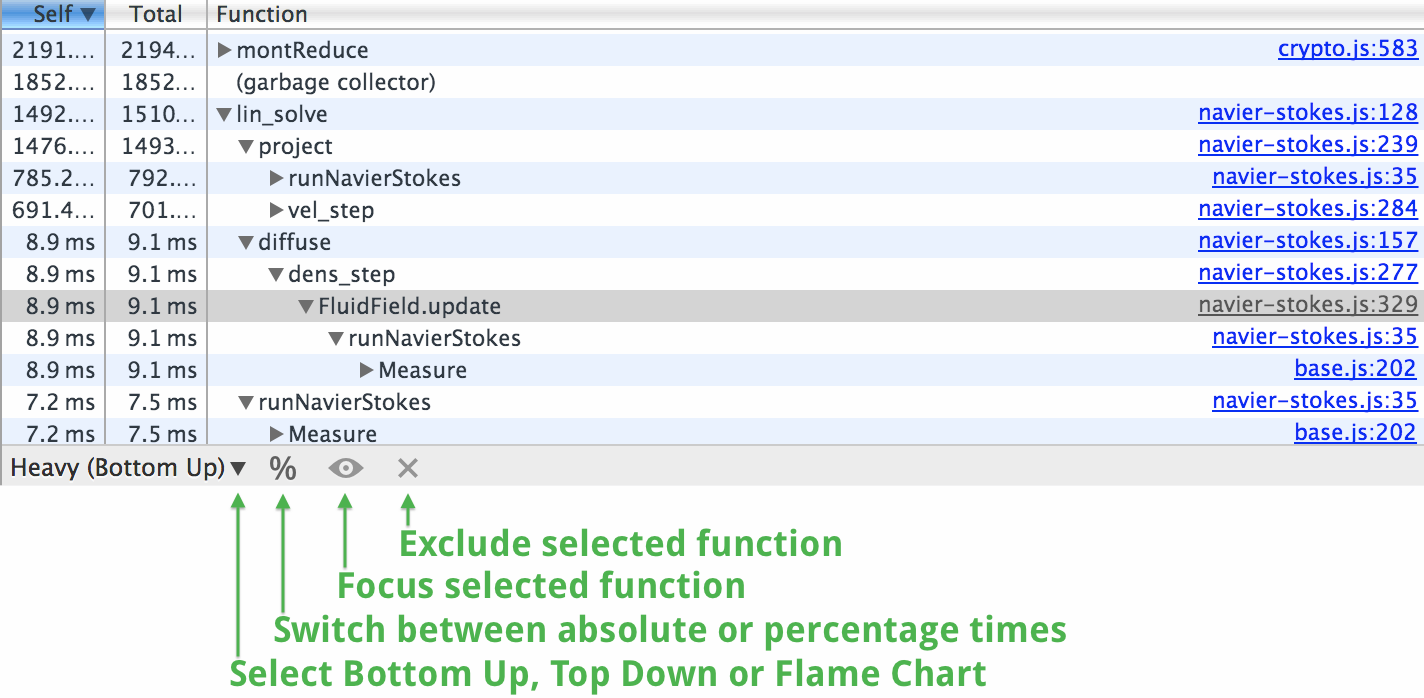
This Bottom Up view arranges functions by how much performance affects them. You can also check the call path for these functions.
Now select the Bottom Up view by clicking the Bottom Up/Top Down button. T hen click the small arrow (program) to the left of the function column. The Top Down view shows the overall structure of the call, starting at the top of the stack.
Note: You can click the Percentage button to see the absolute percentage of time.
Select a function in the function column, and then click the Focus Select Function button (eye icon on the right).
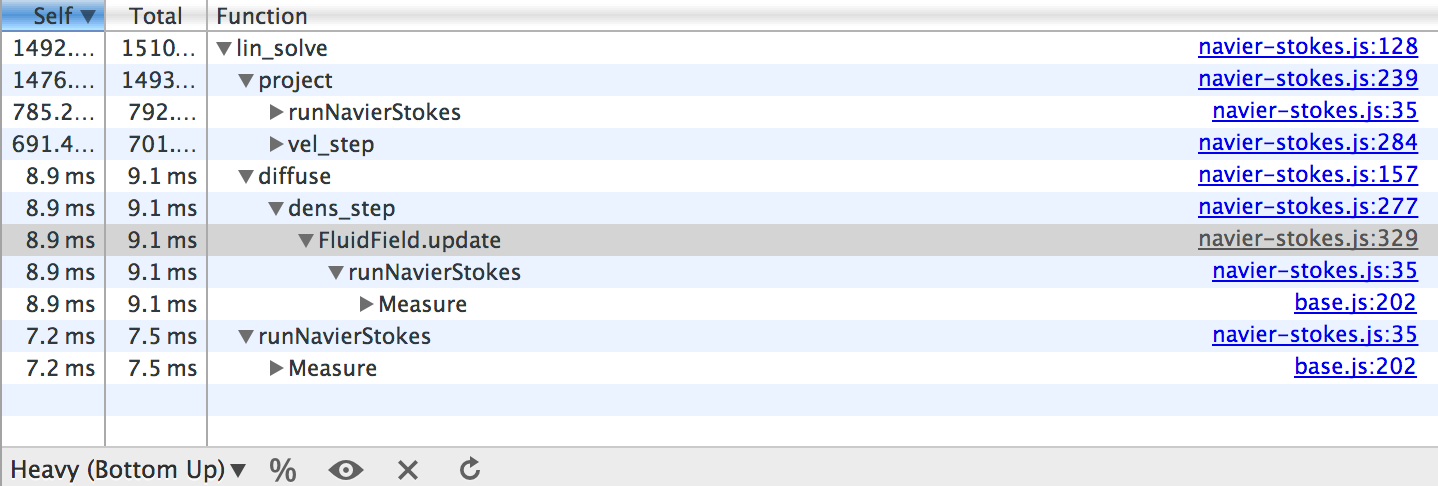
This filters the profile to show only the selected function and its caller. Click the Refresh button in the lower right corner of the window to restore it to its original condition.
Select the function column for a function, and then click the Exclude Select Function button (X icon). Depending on the features you choose, you should see something like this:
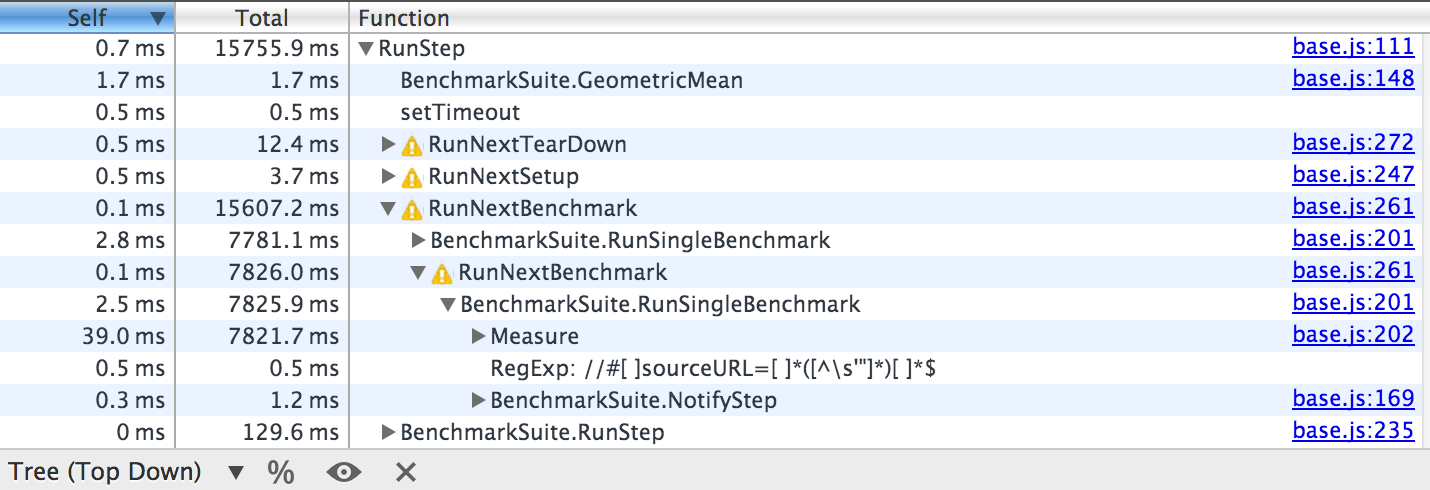
The Exclude Selection Function button removes the selected function from the configuration file and manages the caller throughout the exclusion function time. Click the Refresh button to restore it to its original condition.
You can record multiple profiles. Click the Start Analysis button, reload the V8 base page, and then click the Stop Analysis button.
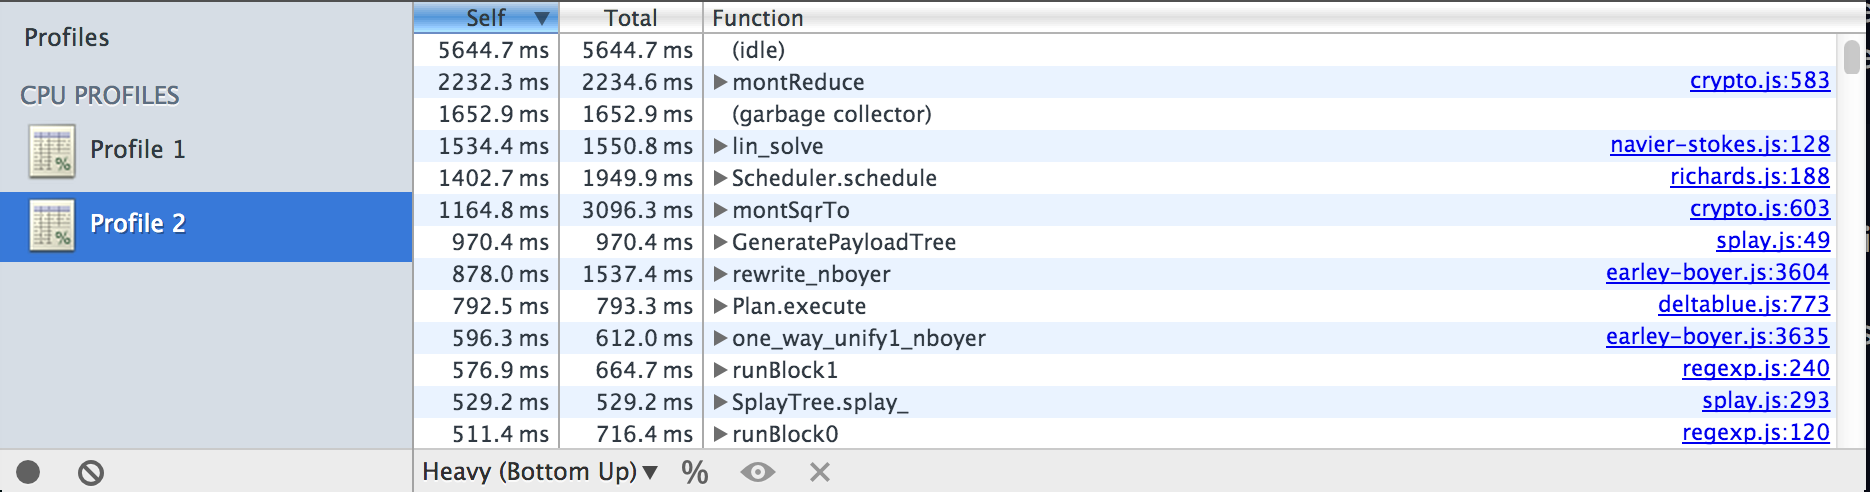
The bar on the left lists your profile records, and the tree view on the right shows a summary of the selected profile.
Use a flame chart
The Flame Chart view provides a visual representation of JavaScript processing over time, similar to those in the timeline and network panels. Using the Flame Chart feature in Details view, after executing JavaScript and CPU profiles, you can view profile data in several different ways.
Visual execution path
By visually analyzing and understanding the function call procedure, you can better understand the execution path of your application.
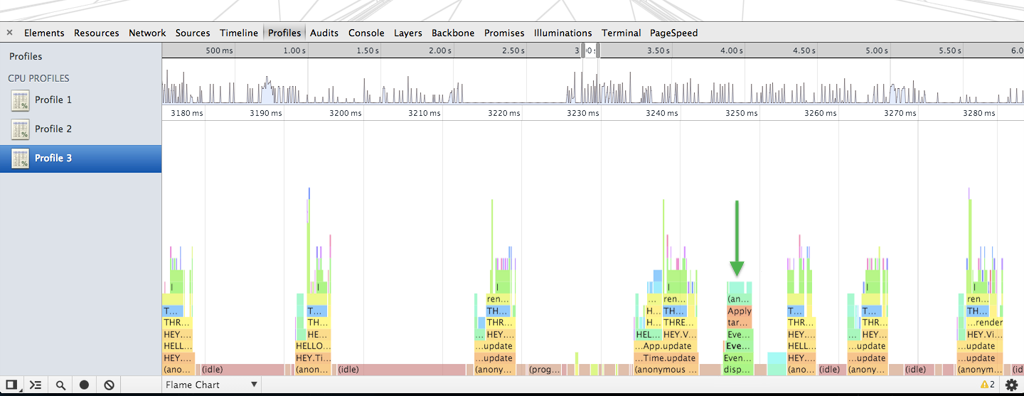
Identify outlier values with color coding
When you narrow down identifiable patterns of repetition, you can optimize, or more importantly, you can find outlier values or unexpected ones that make execution easier.
Visual JavaScript data analyzers on time scales (e.g. timelines)
Other JavaScript analysis reports data over time, while flame charts report data over time. T his means that when you see events happening, you can really get a perspective on JavaScript execution on a time scale. For example, seeing a large yellow striped schedule is the perfect way to see the problem.
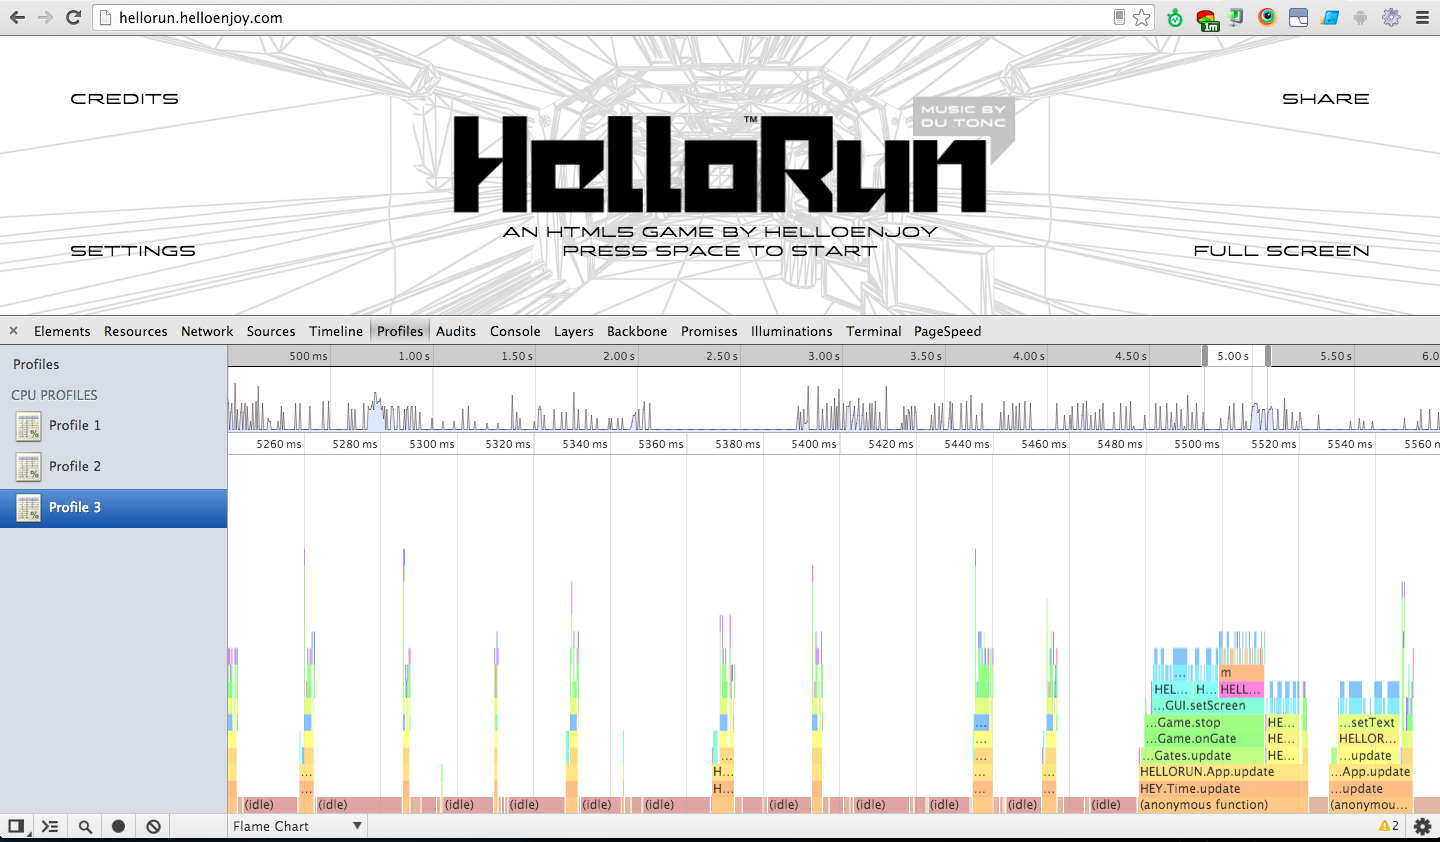
Note: The horizontal axis represents the time and the vertical axis represents the call stack. T he Expensive function is wide. T he Y-axis represents the call stack, so a high flame is not necessarily important. Pay close attention to the wide stripes, no matter where they are calling the stack.
How to use the flame map:
1. Open DevTools to find the profile panel.
2. Select Record JavaScript CPU Profile, and then click Start.
3. When you have finished collecting data, click Stop .
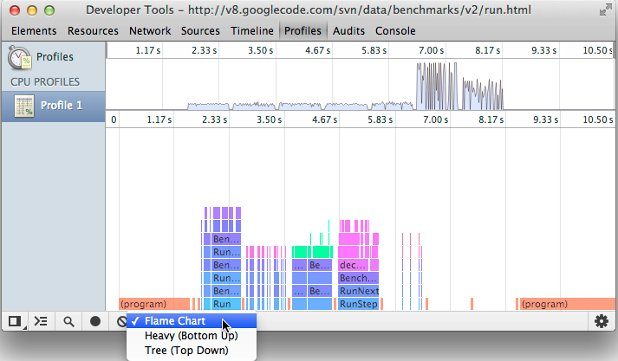
In the overview view, select the flame chart visualization, which is in DevTools at the bottom.
Note: To increase precision analysis time, high-resolution CPU analysis can be enabled in DevTools flame-chart in the configuration file. When enabled, you can zoom in on the graph, even at a tenth of a millisecond interval.
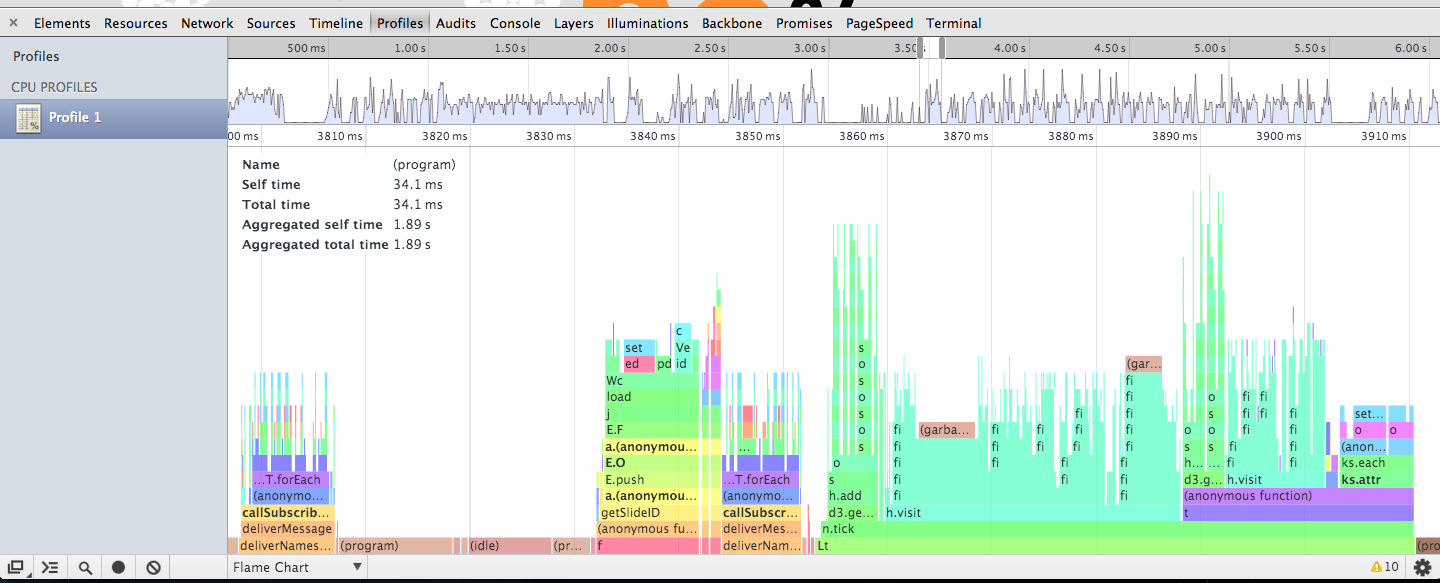
At the top of the panel is an overview that gives a complete record. Y ou can zoom in on a specific area in the overview with a mouse click, as shown below. Y ou can also panoramicly on the left and right by clicking on the white area and dragging the mouse. In Details view, the time scale is reduced accordingly.
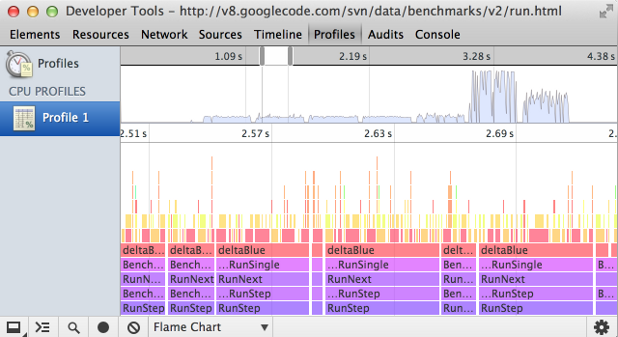
In the Details view, the call stack of a function is represented as a stack "block." B locks at the top of a block are named after lower function blocks. When you hover over a given block, its function name and time data are displayed:
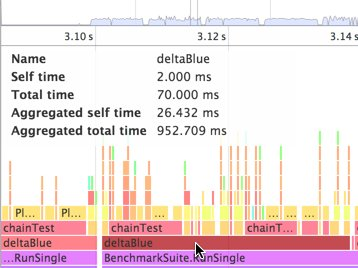
- Name - The name of the function.
- Self-time - How long it takes to complete a call to the current function, including only the declaration of the function itself, not any functions it calls.
- Total time - The time and sum at which the current function is called and other functions are called.
- Self-aggregation time - The aggregation time, the time used to call a function in all records, and not including the time called through that function.
- Total time of aggregation - The total time of the aggregation, the time it takes to call all functions, including the time it takes to call functions through that function.
The colors in the flame chart are random, but the called functions are marked as the same color. T his allows you to see the pattern of execution, and then make it easier to see outlier values. There is no correlation here with the colors used in the timeline.
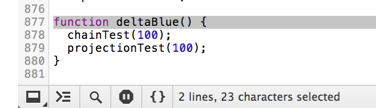
Click on the line in the function block to define the function and you can open the JavaScript file contained in its resource panel.