Analysis of node .js memory leaks
Jun 01, 2021 Article blog
Table of contents
This article will first introduce you to some theoretical knowledge, and then attached a case of memory leakage, interested students can continue to look down.
Node.js
use the V8 engine, which is characterized by automatic garbage collection (Garbage Collection, GC), so we don't need to manually allocate and free up memory space like
C/C++
when writing code, which is convenient, but still needs to be aware of memory usage to avoid memory leaks ."

From the image above, you can see that the resident memory of
Node.js
is divided into heaps and stacks, as follows:
- heap
-
- Pointer space: Stored objects contain pointers to other objects.
- Data space: Stored objects contain only data (without pointers to other objects), such as strings moved from a new generation.
- New Space/Young Generation: Used to temporarily store new objects, space is divided into two parts, the overall is small, using the Scavenge (Minor GC) algorithm for garbage collection.
- Old Space/Old Generation: Used to store objects that have survived longer than two Minor GCs, garbage collection using the Mark-Sweep-Mark-Compact, Major GC algorithm, which can be divided into two additional spaces:
- Code Space: Used to hold snippets, is the only executable memory (although too large snippets can also be stored in large object spaces).
- Large Object Space: Large objects that hold large objects that exceed other spatial object limits (Page::kMaxRegular HeapObjectSize) (refer to this V8 Commit), where objects are not moved during garbage collection.
- ...
- Stack: Used to hold the original data type, which is also recorded in the stack at the time of the function call.
Stack space is managed by the operating system and developers don't have to worry too much; heap space is managed by the V8 engine, which can be slowed down by memory leaks due to code problems or garbage collection after a long run.
(Recommended tutorial: Getting started with Node)
We can simply observe
Node.js
memory usage with the following code:
const format = function (bytes) {
  return `${(bytes / 1024 / 1024).toFixed(2)} MB`;
};


const memoryUsage = process.memoryUsage();


console.log(JSON.stringify({
    rss: format(memoryUsage.rss), // 常驻内存
    heapTotal: format(memoryUsage.heapTotal), // 总的堆空间
    heapUsed: format(memoryUsage.heapUsed), // 已使用的堆空间
    external: format(memoryUsage.external), // C++ 对象相关的空间
}, null, 2));
external
is the space
C++
object, for example, through new ArrayBuffer (100000);
When you request a piece of
Buffer
memory, you can clearly see an increase in
external
space.
The default size of the related space can be adjusted in MB by the following parameters:
- -- stack_size adjust the stack space
- -- min_semi_space_size adjust the initial value of the new generation of half-space
- -- max_semi_space_size adjust the maximum value of the new generation of half-space
- --max-new-space-size adjusts the maximum value of the new generation of space
- -- initial_old_space_size adjust the initial value of the space of the old generation
- --max-old-space-size adjusts the maximum value of the space of the old generation
More commonly used are
--max_new_space_size
and
--max-old-space-size
There are a lot of articles about the new generation of
Scavenge
recycling algorithms, the old
Mark-Sweep & Mark-Compact
algorithms, and we won't go into that here.
memory leak
Due to improper code, memory leaks are sometimes inevitable, and there are four common scenarios:
- The global variable
- Closure reference
- Event binding
- Cache explosion
Let's give you an example.
The global variable
Variables that are not declared using
var/let/const
are bound directly to
Global
object (node .js) or
Windows
object (in the browser) and are not automatically recycled even if they are no longer in use:
function test() {
  x = new Array(100000);
}


test();
console.log(x);
The output of this code is
[ <100000 empty items> ]
you can see that array x has not been released after the
test
function has run.
Closure reference
Memory leaks caused by closures are often very hidden, such as the following code, can you see where there is a problem?
let theThing = null;
let replaceThing = function() {
  const newThing = theThing;
  const unused = function() {
    if (newThing) console.log("hi");
  };
  // 不断修改引用
  theThing = {
    longStr: new Array(1e8).join("*"),
    someMethod: function() {
      console.log("a");
    },
  };


  // 每次输出的值会越来越大
  console.log(process.memoryUsage().heapUsed);
};


setInterval(replaceThing, 100);
Running this code shows that the output is getting more and more used heap memory, and the key is that in the current V8 implementation, the closure object is shared by all the internal function scopes in the current scope, that is,
theThing.someMethod
and
unUsed
share the same closure
context
theThing.someMethod
to implicitly hold a reference to the previous
newThing
so
theThing -> someMethod -> newThing -> 上一次 theThing ->...
the circular reference to , resulting in a
longStr: new Array(1e8).join("*")
every time the
replaceThing
function is executed, and it is not automatically reclaimed, resulting in more and more memory being consumed and eventually a memory leak.
There is a clever solution to this problem: by introducing new block-level scopes,
newThing
declarations, usage, and external isolation break sharing and block circular references.
let theThing = null;
let replaceThing = function() {
  {
    const newThing = theThing;
    const unused = function() {
      if (newThing) console.log("hi");
    };
  }
  // 不断修改引用
  theThing = {
    longStr: new Array(1e8).join("*"),
    someMethod: function() {
      console.log("a");
    },
  };


  console.log(process.memoryUsage().heapUsed);
};


setInterval(replaceThing, 100);
Here's
{ ... }
A separate block-level scope is formed, and there is no reference externally, so
newThing
is automatically recycled when it is
GC
for example, running this code output on my computer is as follows:
2097128
2450104
2454240
...
2661080
2665200
2086736 // 此时进行垃圾回收释放了内存
2093240
Event binding
Memory leaks caused by event binding are common in browsers and are typically caused by event response functions not being removed in a timely manner, resulting in duplicate bindings or unprocessed event response functions after
DOM
elements have been removed, such as the following
React
code:
class Test extends React.Component {
  componentDidMount() {
    window.addEventListener('resize', function() {
      // 相关操作
    });
  }


  render() {
    return <div>test component</div>;
  }
}
<Test />
component listens for
resize
while mounted, but does not handle the function when the component is removed, and if the <
<Test />
is mounted and removed very frequently, many useless event listening functions are bound to
window
resulting in memory leaks.
This problem can be avoided by:
class Test extends React.Component {
  componentDidMount() {
    window.addEventListener('resize', this.handleResize);
  }


  handleResize() { ... }


  componentWillUnmount() {
    window.removeEventListener('resize', this.handleResize);
  }


  render() {
    return <div>test component</div>;
  }
}
(Recommended tutorial: Node.js tutorial)
Cache explosion
Memory caching through
Object/Map
can greatly improve program performance, but it is likely that the size and expiration time of the cache are not controlled, and the data that causes the failure is still cached in memory, resulting in memory leaks:
const cache = {};


function setCache() {
  cache[Date.now()] = new Array(1000);
}


setInterval(setCache, 100);
In the above code, the cache is constantly set up, but the cached code is not released, resulting in memory eventually being burst.
If memory caching is indeed required, it is highly recommended to use
lru-cache
as an
npm
package that sets the cache expiration date and maximum cache space to avoid cache explosion through
LRU
retirement algorithm.
Memory leak positioning is practical
When there is a memory leak, positioning is often cumbersome for two main reasons:
- When the program starts running, the problem is not immediately exposed and takes a while, or even a day or two, to recur.
-
The prompt information for the error is very vague and you can often only see
heap out of memoryerror message.
In this case, there are two tools you can use to fix the problem:
Chrome DevTools
and
heapdump
heapdump
does what its name says - to take a snapshot of the state information of the heap in memory, export it, and then we import it into
Chrome DevTools
to see specific details, such as what objects are in the heap, how much space is occupied, and so on.
Next, we'll take a look at the memory leak example in the closure reference above.
First, after
npm install heapdump
is installed, modify the code to look like this:
// 一段存在内存泄漏问题的示例代码
const heapdump = require('heapdump');


heapdump.writeSnapshot('init.heapsnapshot'); // 记录初始内存的堆快照


let i = 0; // 记录调用次数
let theThing = null;
let replaceThing = function() {
  const newThing = theThing;
  let unused = function() {
    if (newThing) console.log("hi");
  };


  // 不断修改引用
  theThing = {
    longStr: new Array(1e8).join("*"),
    someMethod: function() {
      console.log("a");
    },
  };


  if (++i >= 1000) {
    heapdump.writeSnapshot('leak.heapsnapshot'); // 记录运行一段时间后内存的堆快照
    process.exit(0);
  }
};


setInterval(replaceThing, 100);
On lines 3 and 22, snapshots of the initial state are exported and snapshots after 1000 loops are exported and saved as
init.heapsnapshot
and
leak.heapsnapshot
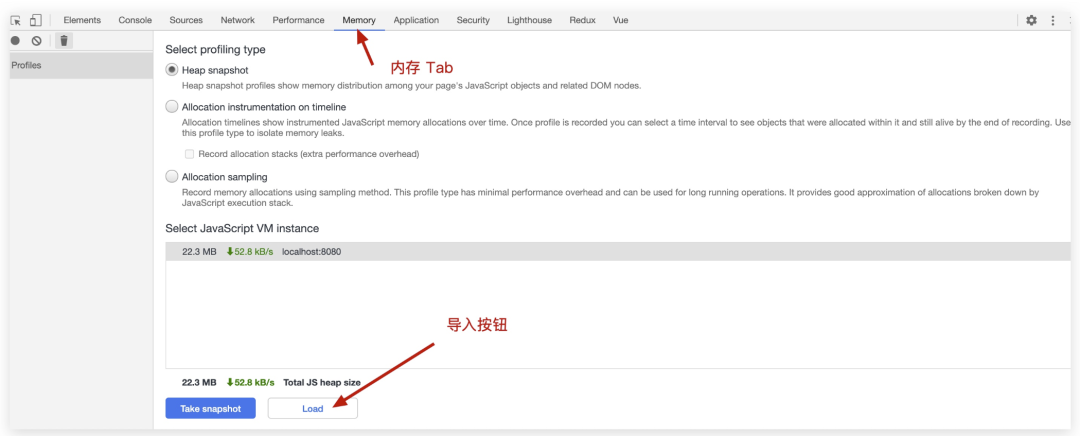
Then open
Chrome
press F12 to call up the
DevTools
panel, tap
Memory
Tab, and finally import the two snapshots you just took in turn via the Load button:

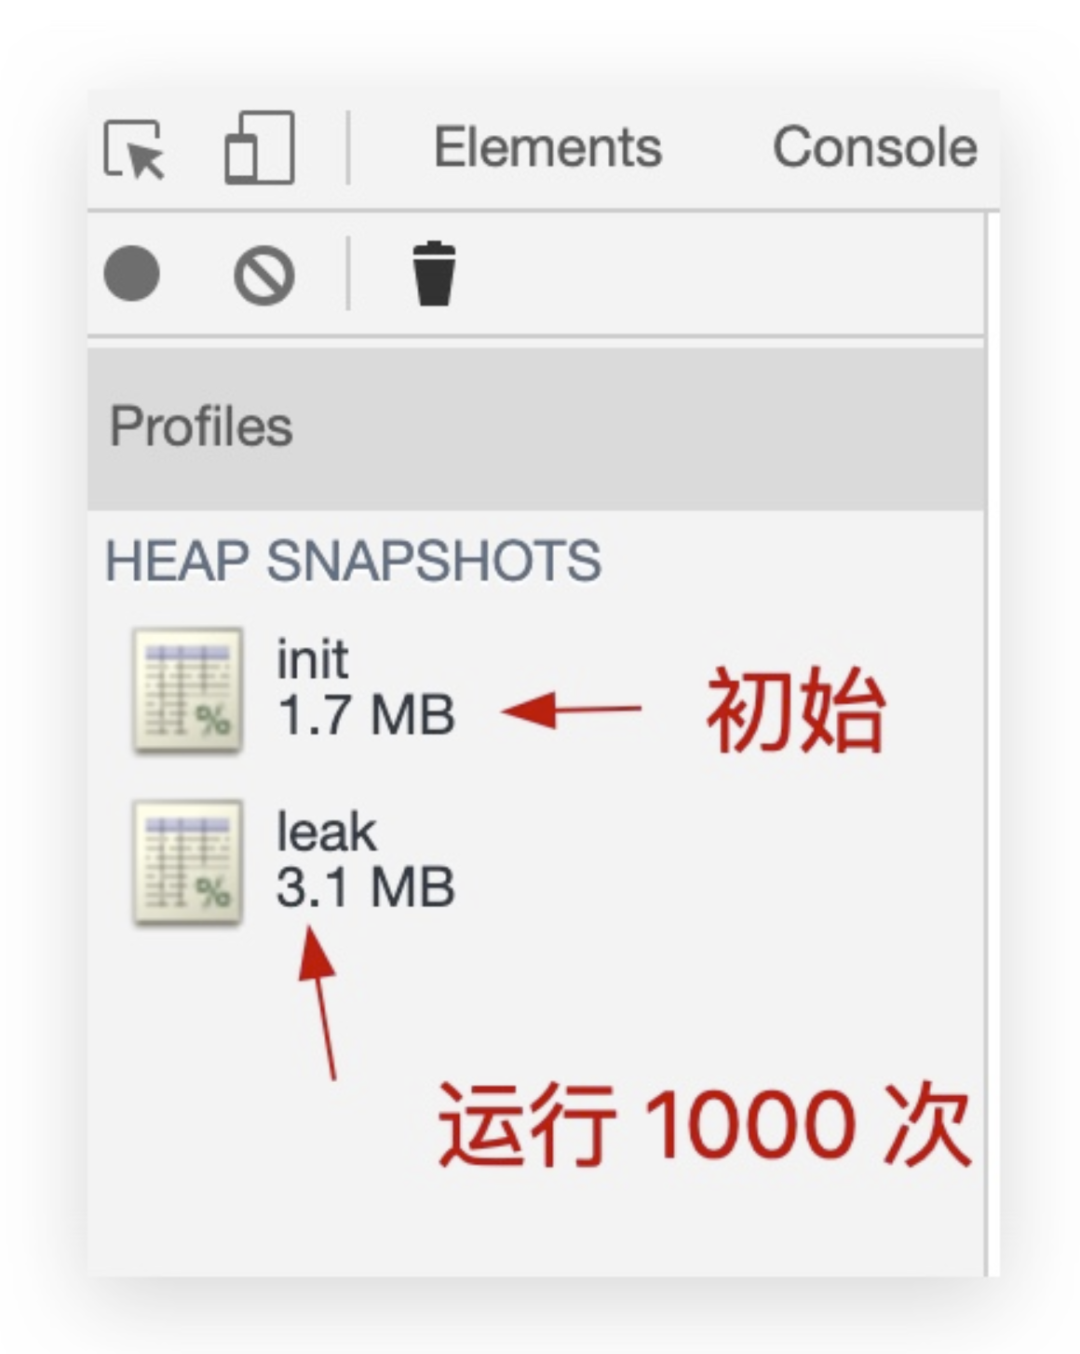
After importing, you can see a significant increase in heap memory on the left, from 1.7 MB to 3.1 MB, almost doubling:

The next critical step is to click on the
leak
snapshot and compare it to the
init
snapshot:

The red box on the right circles two columns:
- Delta: Represents the number of changes
- Size Delta: Describes the size of the space that has changed
You can see that the top two items that grow the most are stitched strings (concatenated strings) and closures, so let's take a look at what's specific:


From these two diagrams, it is very intuitive to see that the closure context of
theThing.someMethod
function and the memory leak caused by the long stitching string
theThing.longStr
the problem is basically positioned here, we can also click on the
Object
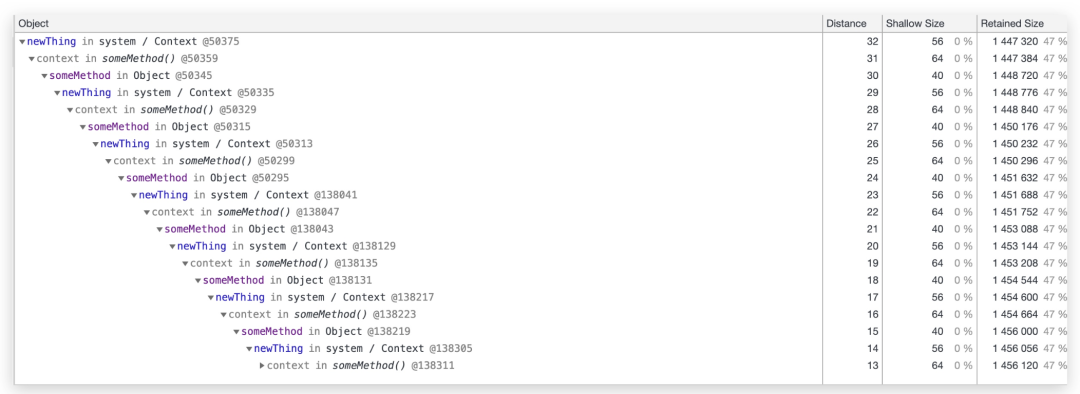
module below to see the relationship between the call chain more clearly:

It is clear in the figure that the memory leak is due to the rapid growth of memory due to the chain dependency of
newTHing <- 闭包上下文 <- someMethod<- 上一次 newThing
The
distance
in the second column in the figure represents the distance of the variable from the root node, and therefore the highest-level
newThing
is the furthest, representing the relationship between the subordinate reference superiors.
(Recommended micro-classes: Node.js micro-classes)
Source: www.toutiao.com/a6863362442957849102/
Above is
W3Cschool编程狮
on the Node .js memory leakage analysis of the relevant introduction, I hope to help you.