Posts about SAS
SAS simulation
May 27, 2021 00:00 0 Comment SAS
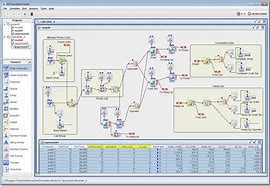
SAS simulation, Simulation is a computational technique that uses repeated calculations on many different random samples to estimate statistics. U, sing SAS, we can s
SAS SQL
May 27, 2021 00:00 0 Comment SAS
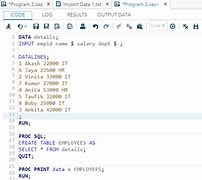
Grammar, Grammar, SQL creation operations, SQL read operations, SQL UPDATE operation, Remove the action in SQL, SAS provides extensive support for most popular relationship databases by using SQL queries in SAS programs. M, ost ANSI SQL syntaxes are supported. T
SAS format dataset
May 27, 2021 00:00 0 Comment SAS
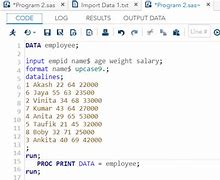
Grammar, Grammar, Cases, Use PROC FORMAT, Sometimes we prefer to display the analyzed data in a format that is different from what already exists in the dataset. F, or example, we want to add
SAS dataset sorting
May 27, 2021 00:00 0 Comment SAS
Grammar, Grammar, Cases, Reverse sorting, Cases, Sort multiple variables, Cases, The dataset in the SAS can sort any variable that exists in it. T, his helps in data analysis and performing other options, such as merging, etc. S, o
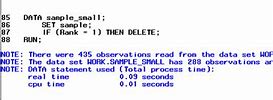
SAS subset dataset
May 27, 2021 00:00 0 Comment SAS
Sub-set variables, Sub-set variables, Grammar, Cases, Sub-set observation, Grammar, Cases, Setting up sub-settings for the SAS dataset means extracting a portion of the dataset by selecting a smaller number of variables or a smaller number o
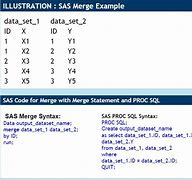
SAS merges datasets
May 27, 2021 00:00 0 Comment SAS
Grammar, Grammar, An example of data consolidation, The value is missing from the matching column, Cases, Only matches are merged, Cases, Multiple SAS datasets can be combined based on specific public variables to give a single dataset. T, his is done, using, the MERGE, statement and the
The SAS connection dataset
May 27, 2021 00:00 0 Comment SAS
Syntactic, Syntactic, Cases, Scheme, Different numbers of variables, Cases, Different variable names, Cases, Different variable lengths, Cases, You can use set statements to connect multiple SAS datasets to provide a single dataset. T, he total number of observations in the connected dataset i
SAS Date Times date time
May 27, 2021 00:00 0 Comment SAS
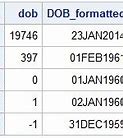
Cases, Cases, Cases, Dates in SAS are calculated in a special way, with January 1, 1960 as the center point, with a date of 0, a date of 1 for the next date, and so on. T,
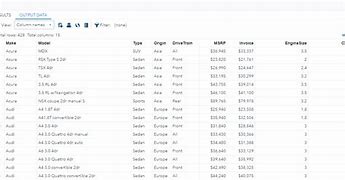
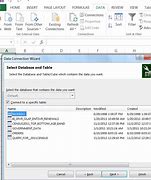
The SAS reads the original data
May 27, 2021 01:00 0 Comment SAS
Read the ASCII (text) dataset, Read the ASCII (text) dataset, Cases, Read the separated data, Cases, Read Excel data, Cases, Read the hierarchical file, Cases, SAS can read data from a variety of sources, including many file formats. T, he file format used in the SAS environment is described below., ASCII (te
SAS histogram
May 27, 2021 01:00 0 Comment SAS
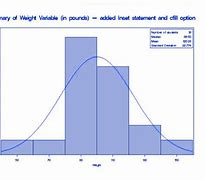
Grammar, Grammar, Simple histogram, Cases, A histogram with a curved fit, Cases, A histogram is a graphical display of data that uses bars of different heights. I, t divides the various numbers in the data set into many ranges. I,
SAS bar chart
May 27, 2021 01:00 0 Comment SAS
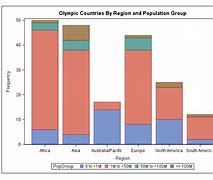
Grammar, Grammar, Simple bar chart, Cases, Stack the bar chart, Cases, Duplex bar chart, Cases, A bar chart represents the data in a rectangular bar, the length of which is proportional to the value of a variable. S, AS uses the procedure PROC SG
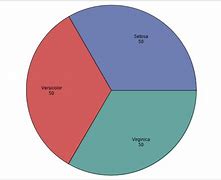
SAS pie chart
May 27, 2021 01:00 0 Comment SAS
Grammar, Grammar, Simple pie chart, Cases, A pie chart with a data label, Cases, Group pie charts, Cases, A pie chart is a slice that represents a value as a circle with a different color., The slices are marked, and the numbers corresponding to each slice
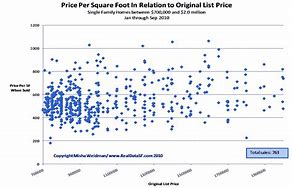
SAS scatter chart
May 27, 2021 01:00 0 Comment SAS
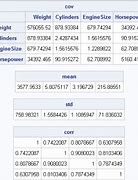
Grammar, Grammar, Simple scatter chart, Cases, Scatter charts and predictions, Cases, Scatter matrix, Cases, Scatter charts are charts that use values from two variables drawn in the Descartes plane. I, t is often used to find out the relationship between two
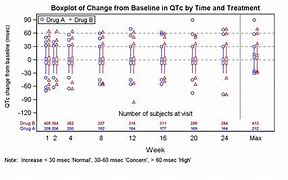
SAS box chart
May 27, 2021 01:00 0 Comment SAS
Syntactic, Syntactic, Simple box diagram, Cases, A box line diagram in a vertical panel, Cases, A box chart in a horizontal panel, A box chart is represented by a graph of its four-digit numeric data group. A, box chart has a line that extends vertically from the box (the crystal,